Apache Access Logs
Apache access logs contain essential insights which can be easily identified by separating them into relevant components such as remote host, remote log name, remote user, date & time, request type, protocol, status, referrer, and user agent. Site24x7 AppLogs supports Apache access logs monitoring by default. It is a unique log monitoring service that enables easy log management by aggregating all your logs under a single web client.
This page provides detailed information on Site24x7's default format of Apache access logs, the file path it is sourced from, and steps to change the format of the file path according to your requirements. Learn more about log management with Site24x7.
Getting started
- Log in to your Site24x7 account.
- Download and install the Site24x7 Server Monitoring agent (Linux).
- Go to Admin > AppLogs > Log Profile and Add Log Profile.
Log file path
Every application writes logs in different folders and files. By default, Apache access logs are sourced from the below-mentioned folder path for the respective Operating System. If you have logs in a different folder, you can mention it under the File Path to source them from that particular folder while creating a log profile.

Log pattern
$RemoteHost$ $RemoteLogName$ $RemoteUser$ [$DateTime:date$] "$RequestFirstLine$" $Status$ $ResponseSize:number$ "$Referer$" "$UserAgent$
This is the default pattern defined by Site24x7 for parsing Apache access logs based on the sample mentioned below.
Sample log
100.10.100.100--[07/Jun/2017:19:53:11 +0530]"GET /test.txt HTTP/1.1" 200 12 "-" "Mozilla/5.0 (X11; Linux x86_64) AppleWebKit/537.36 (KHTML, like Gecko) Chrome/52.0.2743.116 Safari/537.36
The above sample log can be separated into 11 fields, each of which will take its respective value from here and will then be uploaded to Site24x7.
| Field name | Field value |
| Remote Host | 100.10.100.100 |
| Remote Log Name | - |
| Remote User | - |
| Date & Time | 07/June/2017:19:53:11 +0530 |
| Request Type | GET |
| Request URL | test.txt HTTP |
| Protocol | 1.1 |
| Status | 200 |
| Response Size | 12 |
| Referer | - |
| User Agent | Mozilla/5.0(X11;Linux x86_64) AppleWebKit/537.36(KHTML like Gecko Chrome/52.0.2743.116 Safari/537.36 |
To filter the bot traffic from your access logs, you can configure filters on the User Agent field using the Filter Log Lines at Source option available on the log type page.
With this output, you can find out the number of requests that have status greater than 200 or requests that have response time greater than 30 seconds by providing the appropriate condition on the search page of our client.
Apache access logs dashboard
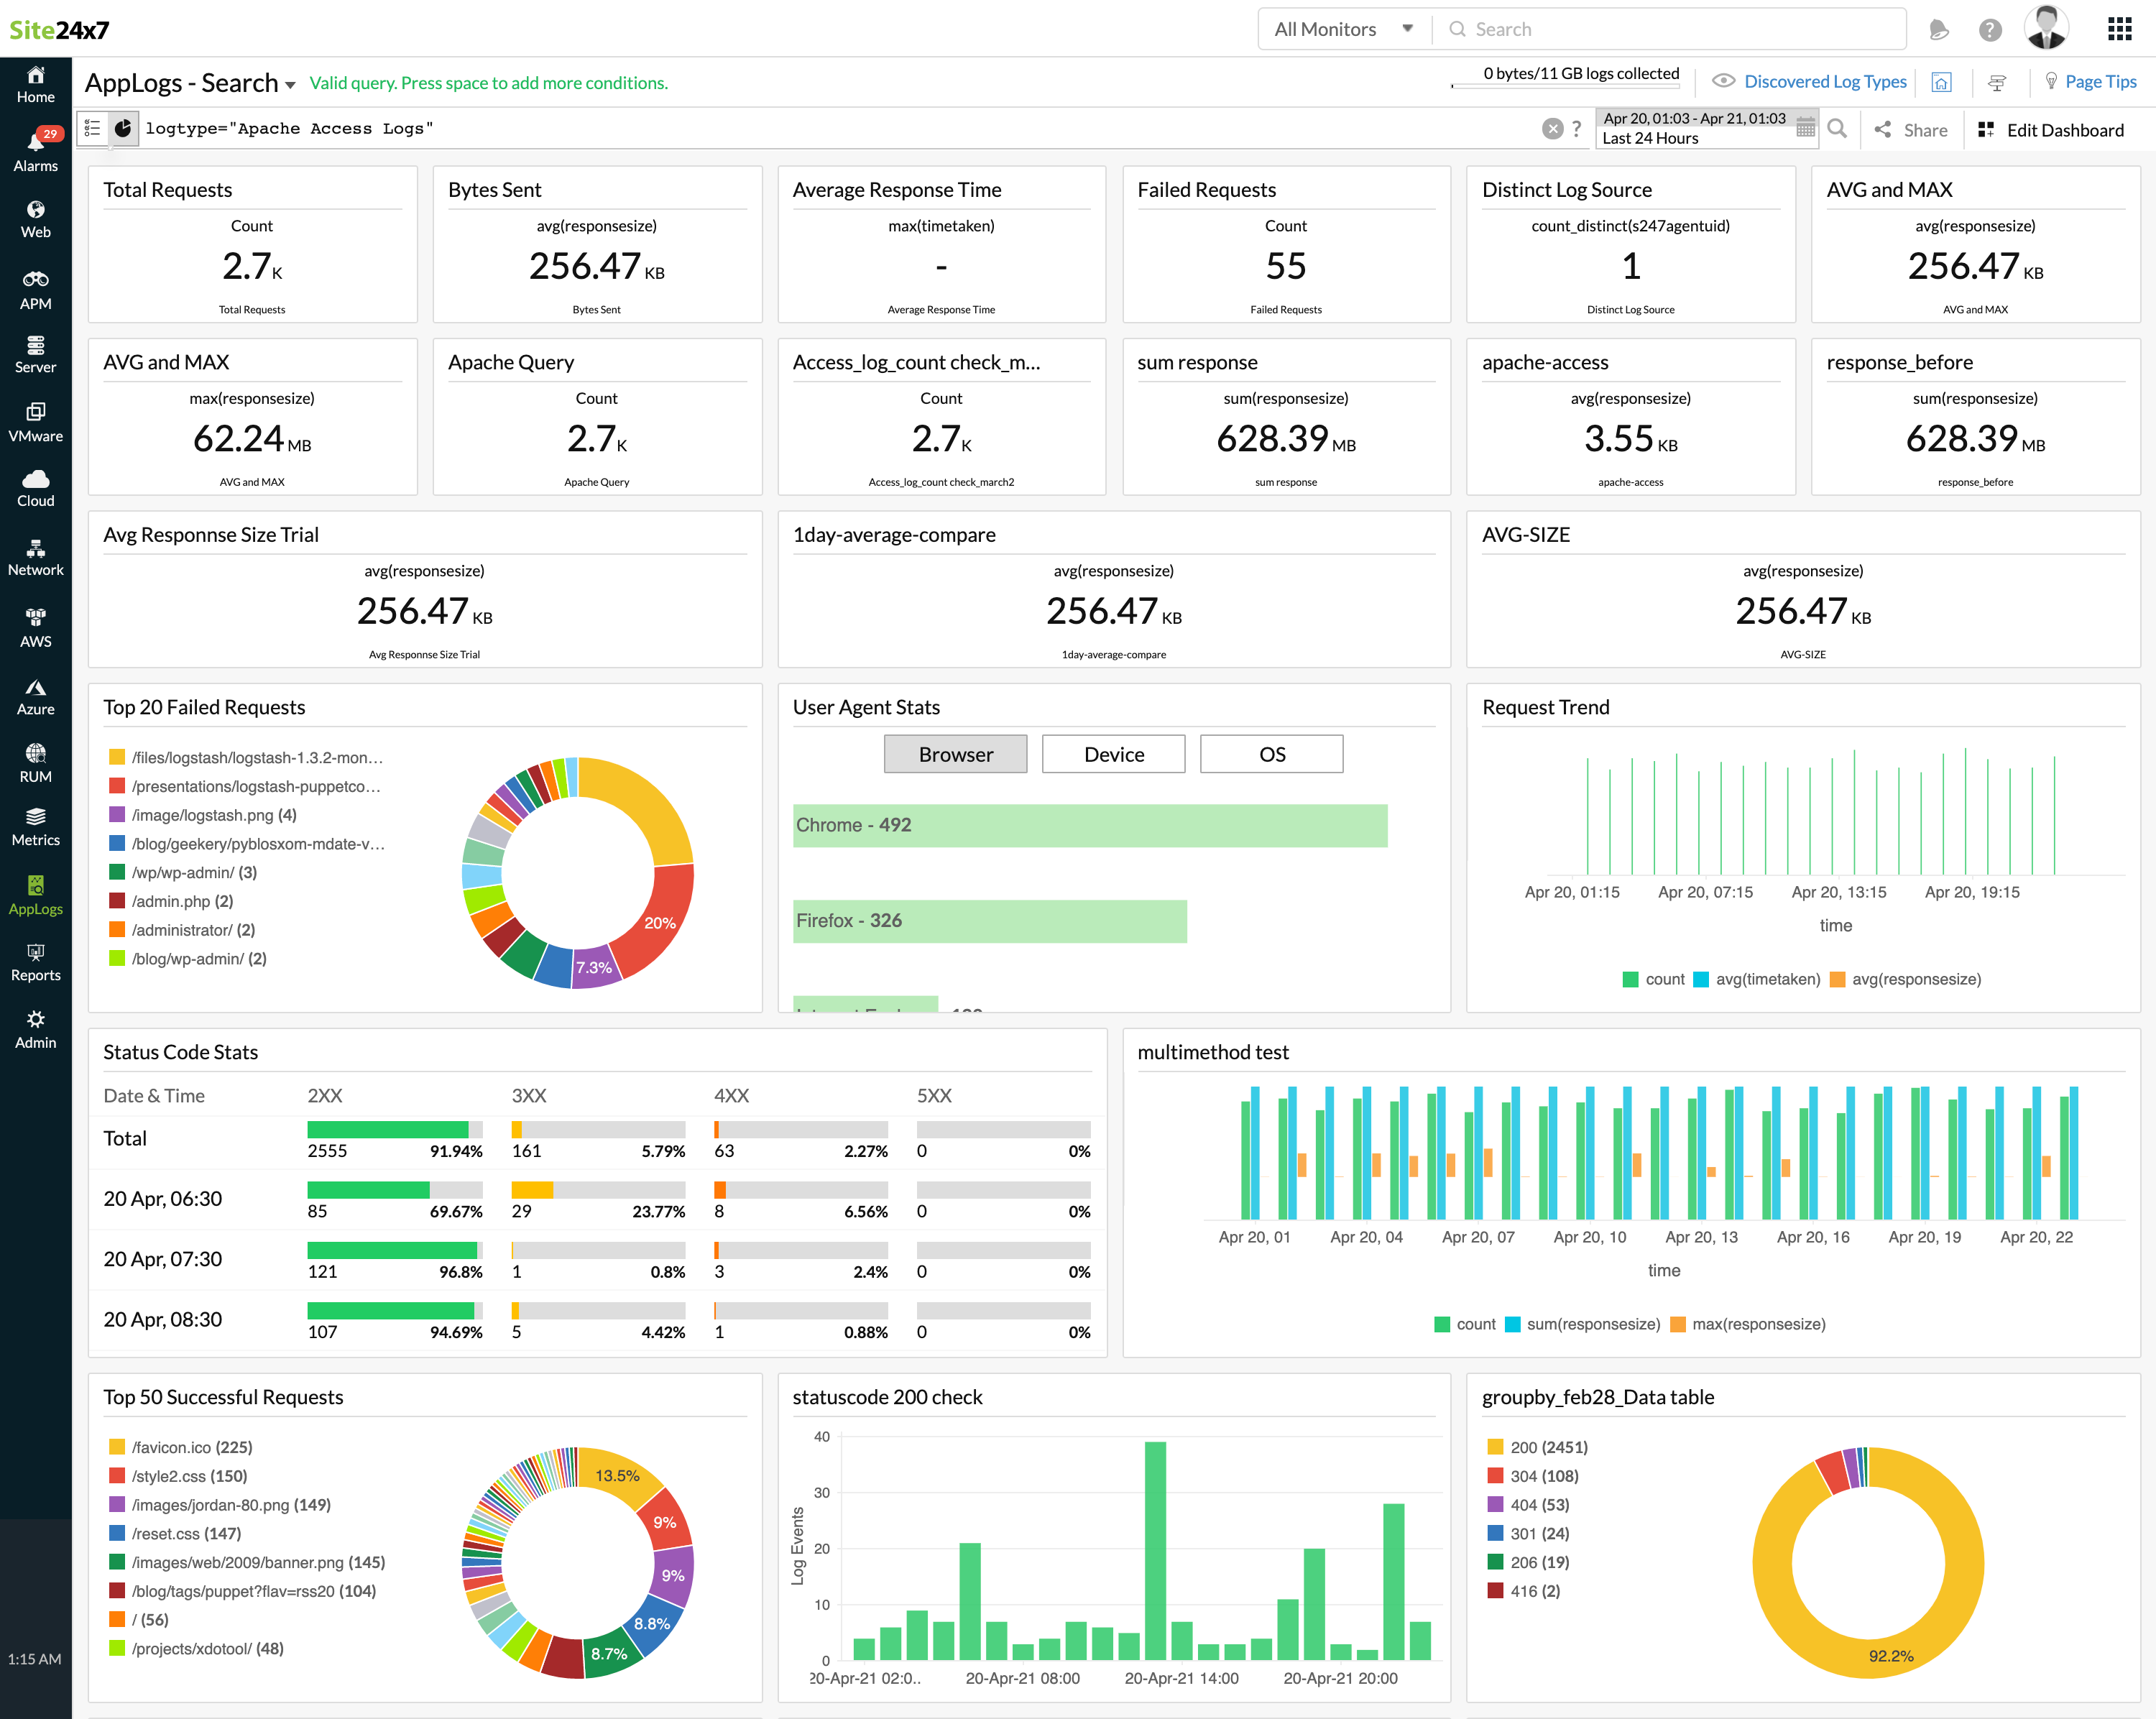
AppLogs creates an exclusive dashboard for every Log Type, and shows a few widgets by default. Here's a list of the widgets available in the Apache access logs dashboard:
- Total Requests
- Average Response Time
- Failed Requests
- Top 20 Failed Requests
- User Agent Stats
- Request Trend
- Status Code Stats
- Response Time Stats
- Top 50 Successful Requests
In addition to the default widgets, your saved searches will also be added to the dashboard automatically.

Configure the Apache monitoring plugin integration and track critical Apache web server metrics, including uptime, CPU load, requests per second, and worker resource data.
Related log types
Further reading
Learn article: Complete guide to monitoring Apache performance
