Evaluate end user experience with real time performance metrics.
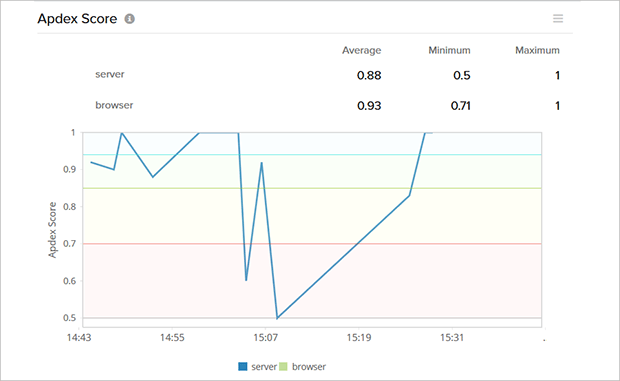
With the help of various performance metrics, get a detailed view on the performance of your application and identify how customer experience can be improved. Key metrics like Apdex Score, Response Time and Throughput enables you to identify bottlenecks that hinder your application performance.

Identify and eliminate slow performing database transactions.
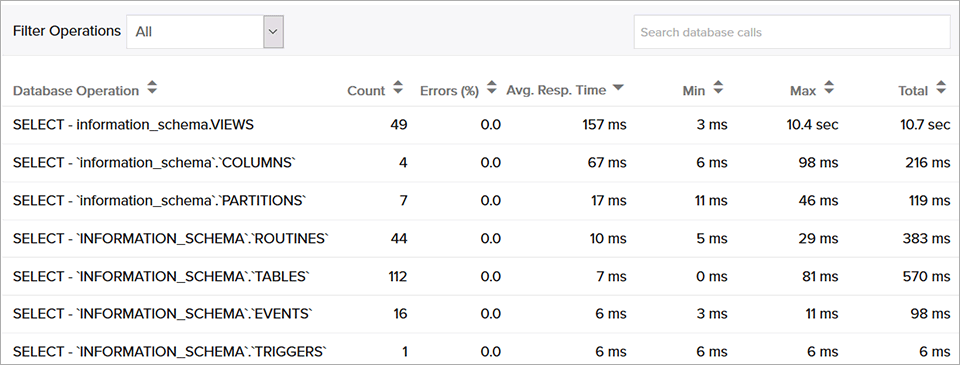
Detect slow database calls, database usage and overall database performance with intuitive and detailed graphical representations. Pinpoint and resolve redundant database queries and optimize your application for enhanced performance.

Featured Support

Isolate slow invocations in your PHP code.
Using traces, identify methods with performance issues and get their execution details in a tree structure. The trace will chart the sequence of invocations of the URL. You can also identify the SQL queries executed during the transaction and thereby identify the worst performing database queries.

Integrate APM Insight with RUM.
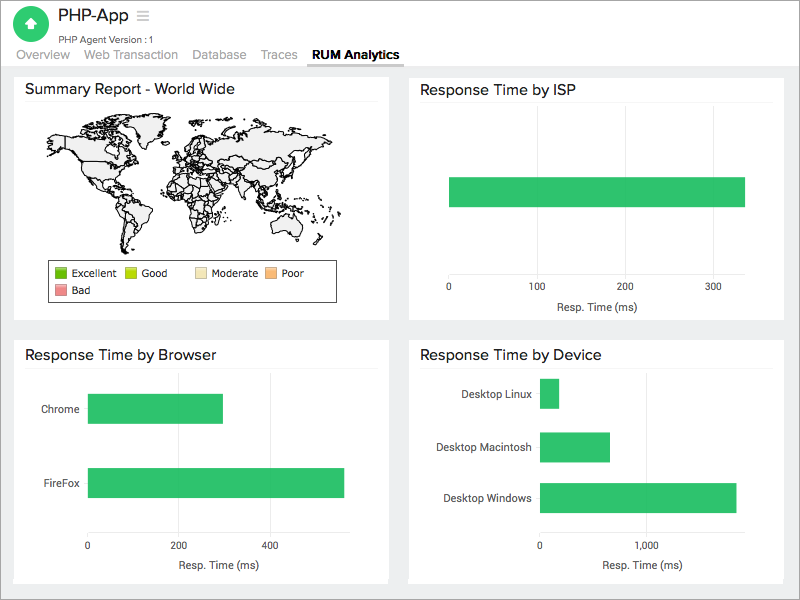
Obtain a 360 degree overview of your application's behavior by combining APM Insight and RUM. Compare and analyze web page performance for different time periods and from different geographical locations. Capture JavaScript code errors as they occur. Monitor individual web transactions and get detailed metrics on network, front-end and back-end response time.
