40+ AWS monitors to choose
At Site24x7, we understand that the AWS services you leverage to ship your applications are constantly evolving. With 40+ integrations of various AWS monitors, you get a unified platform that fits your ever-changing cloud needs. Do more than CloudWatch monitoring with our enhanced AWS monitoring tools.
Elastic Compute Cloud (EC2)
Instance level performance stats, system level data, status check failure alerts along with log support to help you analyze every aspect of your compute environment.
Lambda
Analyze the behavior of your serverless lambda functions. Troubleshoot function execution errors with log support to tune the performance of your application code.
Elastic Beanstalk
Alert on environment status, track additional metrics from the OS and web server logs and view events and notifications emitted by your application for a comprehesive view.
Elastic Container Service (ECS)
Monitor the CPU and memory utilization and reservation metrics on both a cluster and service level to effectively manage your Docker environment.
Elastic Kubernetes Service (EKS)
Track the health and utilization metrics of Kuberenetes running in the AWS cloud for clusters, nodes, and namespaces at service-level and pod-level.
Lightsail Instance
Deep dive into the health metrics of your virtual server deployed in the Amazon cloud with our agentless Lightsail Instance monitoring.
Simple Storage Service (S3)
Monitor the full range of S3 metrics (request, storage and data transfer).Configure checks for your object URL endpoints to measure response time from global locations.
S3 Object
Proactively monitor your S3 object URLS. Run automated checks from global locations and be the first to know when they become slow or down.
Elastic Block Storage (EBS)
Monitor resource usage across a variety of metrics to get complete insight into the operational behavior of your block-level storage volumes attached to your instance.
Elastic File System (EFS)
Track burst balance, client connections, bytes transferred and more for file systems mounted on EC2 instances and on-premises servers.
Storage Gateway
Monitor file gateway, volume gateway, and tape gateway to gather key metrics, and get notified when the gateway operations are done or if a metric(s) falls outside a defined threshold.
Amazon FSx
Monitor your file systems like the windows file server hosted in the Amazon cloud, and set automation to create a backup of the file system.
Relational Database Service (RDS)
Native database metrics for MySQL, PostgreSQL and MariaDB engine, DB instance performance counters and complete Aurora DB support to help you get the entire picture.
DynamoDB
Monitor key performance metrics detailing usage and performance for DynamoDB tables, Global Secondary indexes (GSIs), Global tables, and DynamoDB streams.
ElastiCache
Monitor your Redis and Memcached compliant ElastiCache clusters, identify changing usage patterns and make informed decisions on scaling and optimizing performance.
Redshift
Monitor and alert on system metrics like CPU usage, DB connections and more for your data warehouse cluster and compute nodes to optimize performance.
Neptune
Gather and analyze important performance metrics like freeable memory, and engine uptime for your Neptune DB clusters.
Lightsail Database
Keep track of health metrics for your managed databases to maintain the reliability of your applications.
Database Migration Service
Migrate your data in databases efficiently by tracking the DMS replication tasks and replication instances.
Elastic Load Balancing
Full monitoring support for all three types of load balancers – Classic, Application, and Network to help you troubleshoot client latency issues and connection errors.
CloudFront
Set up near real-time alerts on operational data, visualize CloudFront usage, and track trends in metrics like data transfer and requests for each web distribution.
Direct Connect
Gain visibility into the virtual interface, optical power, and data transfer rates of the dedicated network connection between your on-premises infrastructure, and business data center in AWS cloud.
VPC-VPN
Monitor activity and connection state for individual VPN endpoints (tunnels) and connection to effectively manage your IPsec connection between your remote network and AWS.
API Gateway
Monitor API calls, latency, integration latency, 400 and, 500 errors for all API stages associated with your deployment. Drill deep into method-level stats to solve problems in API execution and implementation.
Route 53
From tracking DNS queries forwarded by Resolver endpoints to Route 53 health check status gain a comprehensive insight into the Domain Name System (DNS) service.
NAT Gateways
Monitor network throughput interms of bytes and packets and troubleshoot data loss issues for NAT Gateways created in your Virtual Private Cloud (VPC).
Lightsail Load Balancing
Gain insight into the load balancers used for your Lightsail environment and built high-availability applications efficiently.
Transit Gateway
Ensure seamless on-premises connectivity from AWS by gaining insights into the number of bytes/packets dropped, and the data transfer rate.
Kinesis
Get complete insight into your real-time streaming data pipeline from source to destination with support for Data Streams, Video Streams, Firehose, and Data Analytics.
CloudSearch
Monitor and alert on domain metrics like successful requests and index utilization to better manage search clusters and make scaling decisions with confidence.
Elasticsearch
Monitor cluster and node-level metrics including CPU utilization, JVM memory pressure, free Storage Space and more to know when to reconfigure your Elasticsearch domains.
Elastic MapReduce
Ensure reliability for your big data workloads by tracking HDFS and Map/Reduce counters like disk capacity utilization, number of map tasks running, number of reduce tasks remaining and more.
Simple Queue Service (SQS)
Configure thresholds for metrics like the number of messages, visible/deleted and age of the oldest message and get notified when your queue stalls or falls behind.
Simple Notification Service (SNS)
Visualize, monitor and alert on usage metrics to understand the behavior of the pub/sub messaging and notification service powering your distributed application.
Simple Email Service (SES)
Complete monitoring for email sending events including bounces and complaints across your SES account to help resolve email deliverability issues faster.
Step Functions
Track state machine metrics like executions started and executions timed out to address run time errors and make changes to your visual workflow with confidence.
Amazon MQ
Monitor resource usage and destination metrics for the message broker instances in the cloud.
Amazon EventBridge
Route real-time alerts from Site24x7 to other AWS services or custom applications with EventBridge.
Web Application Firewall (WAF)
Observe and alert on metrics like allowed and blocked requests across your web access control lists (web ACLs) and rules to optimize your firewall security configurtion.
Key Management Service
Know when to reimport key material. Observe and receive alerts on the metric key material expiration for customer managed CMKs whose origin is external.
Certificate Manager
Check the renewal status for public SSL/TLS certificates deployed on your websites and other cloud resources.
Amazon GuardDuty
Monitors the AWS network for anomalous behavior which can indicate cyberattacks or other unauthorized activities.
Amazon WorkSpaces
Monitor AWS VDI and schedule automations to take remedial actions like start, stop, reboot, or restart the WorkSpaces client.
AWS cost management solution
Monitor AWS and understand spending patterns in the cloud for your organization under a single platform. Visualize costs, allocate AWS budgets, utilize tags, and create business units for cloud costs to track your AWS cost optimization journey.
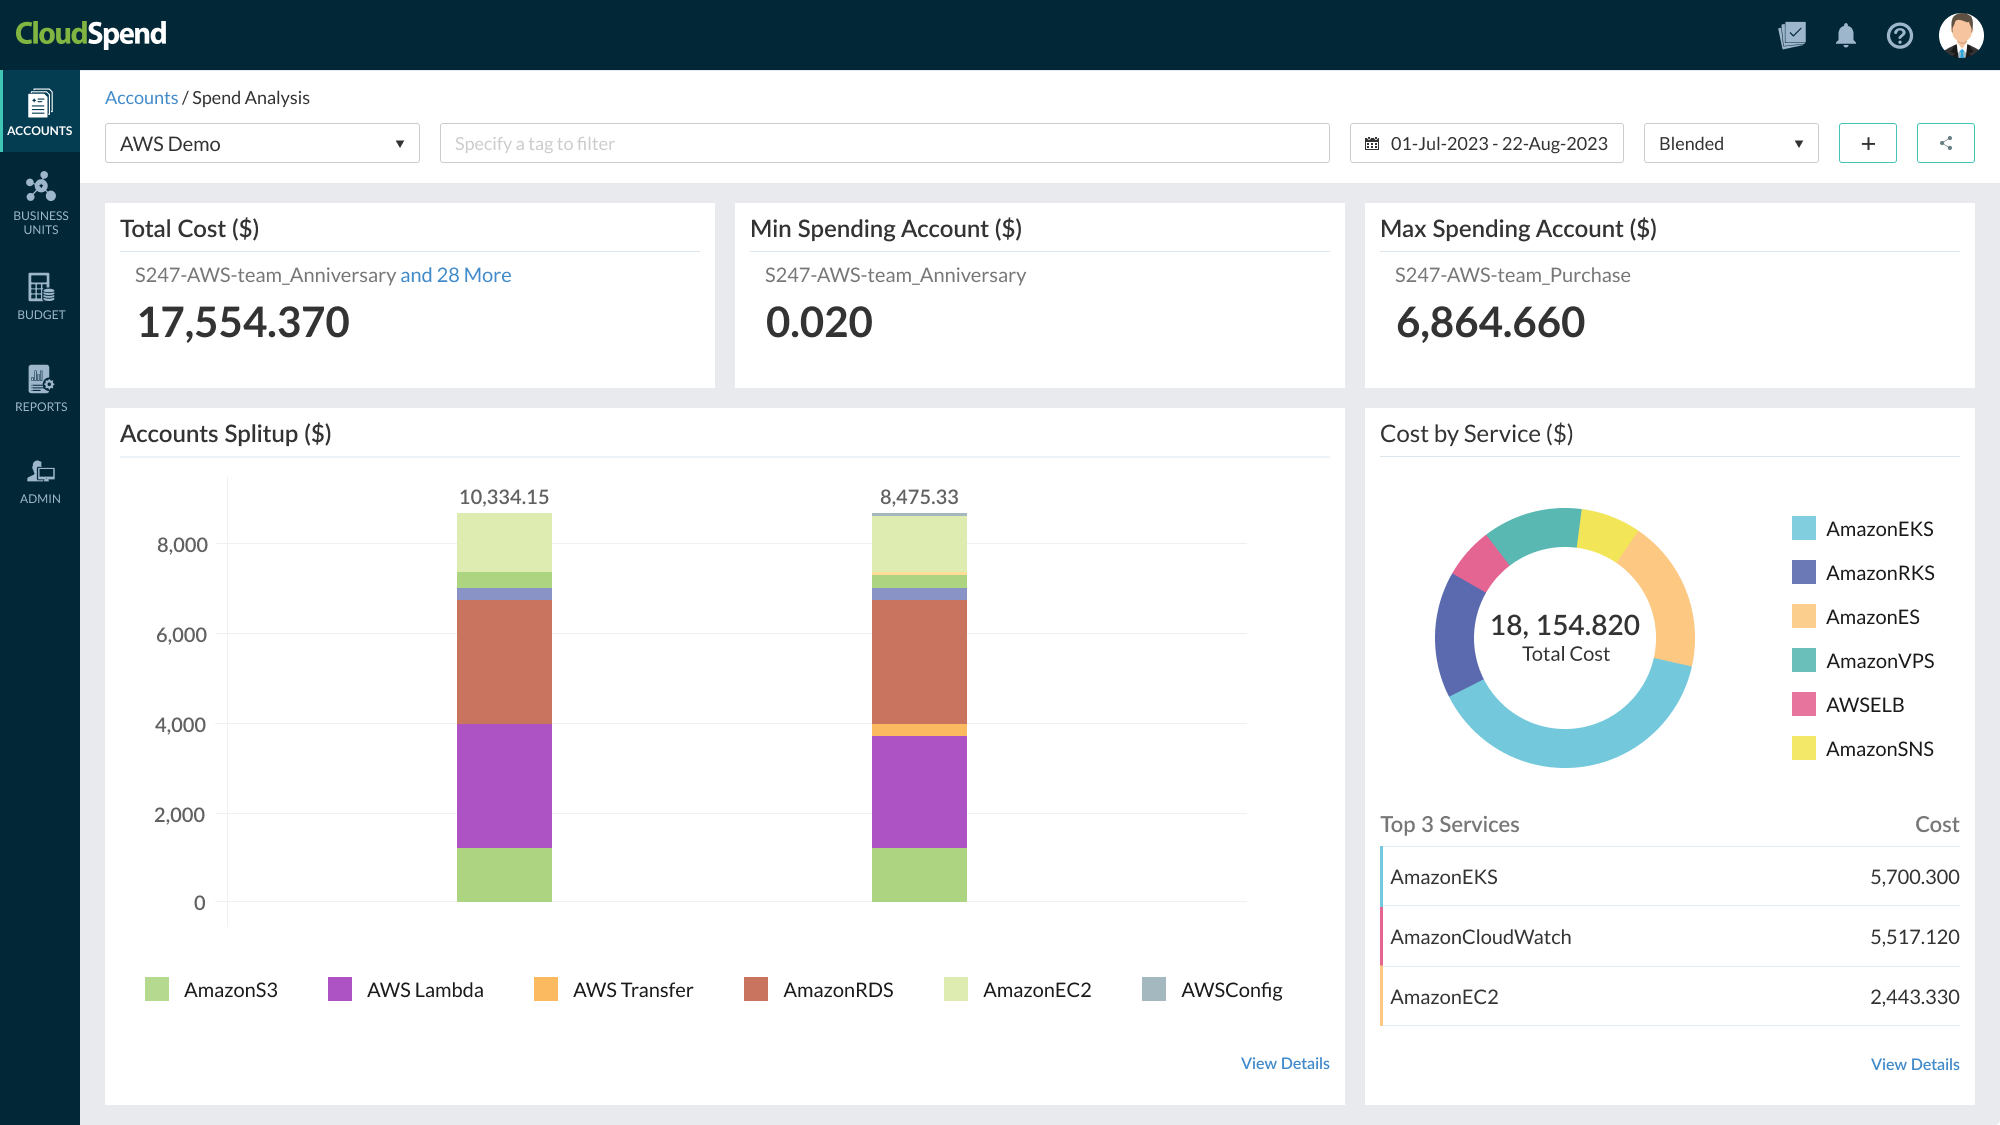
Powerful features of AWS Monitoring Tool
AWS Monitoring Best Practices
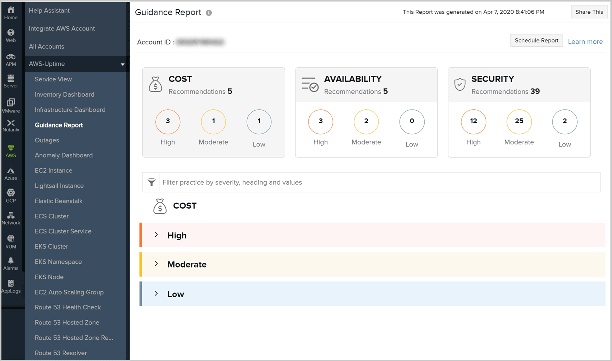
Deploy and configure cloud resources as per best practices. With 140+ recommendation checks, our Guidance Report inspects your AWS environment and finds opportunities to reduce costs, increase fault tolerance, and close security gaps.
Custom Dashboards and Reporting
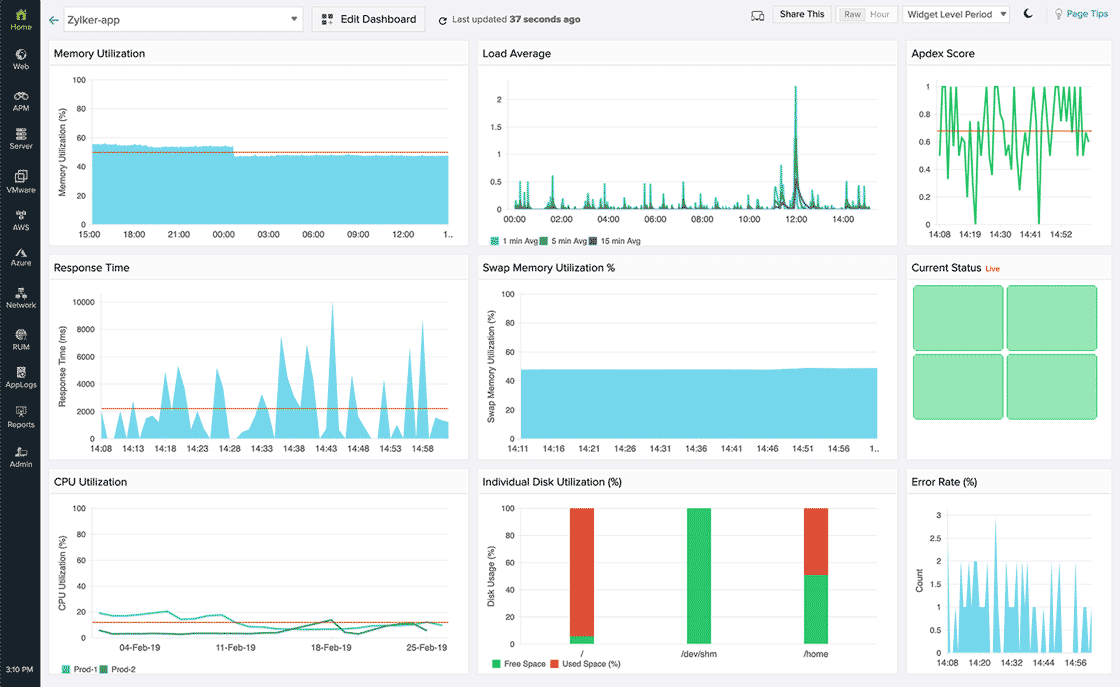
See how your infrastructure is performing over time. Use our simple drag-and-drop interface and numerous visualization widgets to bring metrics into a single view. Our out-of-the box reports give you comprehensive insight into your AWS ecosystem.
Schedule Automations
Automatically execute repetitive manual tasks across AWS resources, plus schedule the automation(s) to take place one after the other when an incident occurs. In response to an alert, stop idle RDS instances, restart runaway EC2 instances, invoke Lambda workflows, rebuild a WorkSpace, and many more.

AI-powered insights
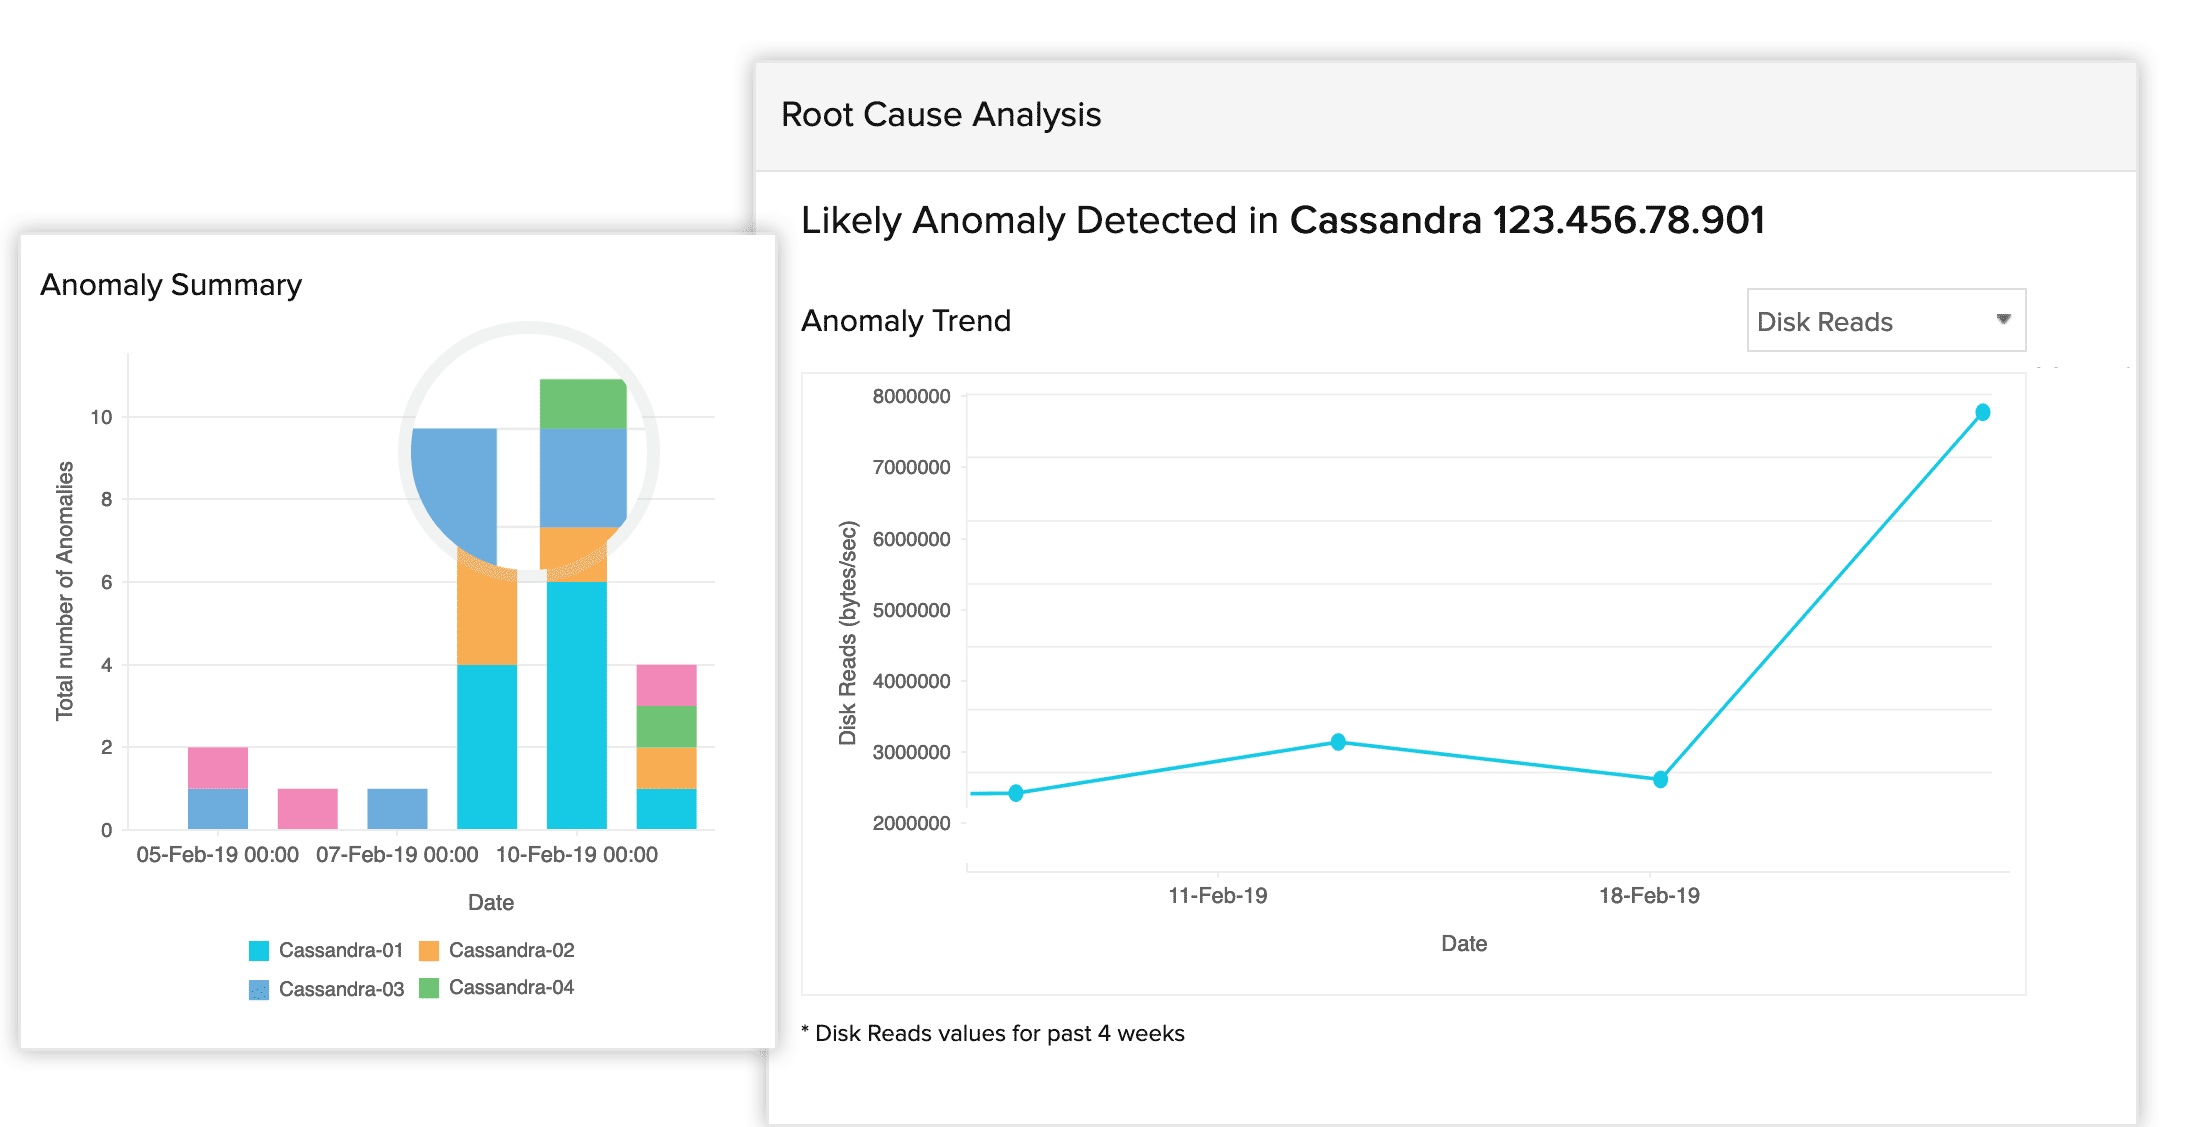
With each day the systems that power our apps and the metrics they emit are getting more complex. Identify metric values that don't conform with expected behavior using our machine learning powered anomaly detection and forecasting engine to preempt resource constraints and prevent potential issues.
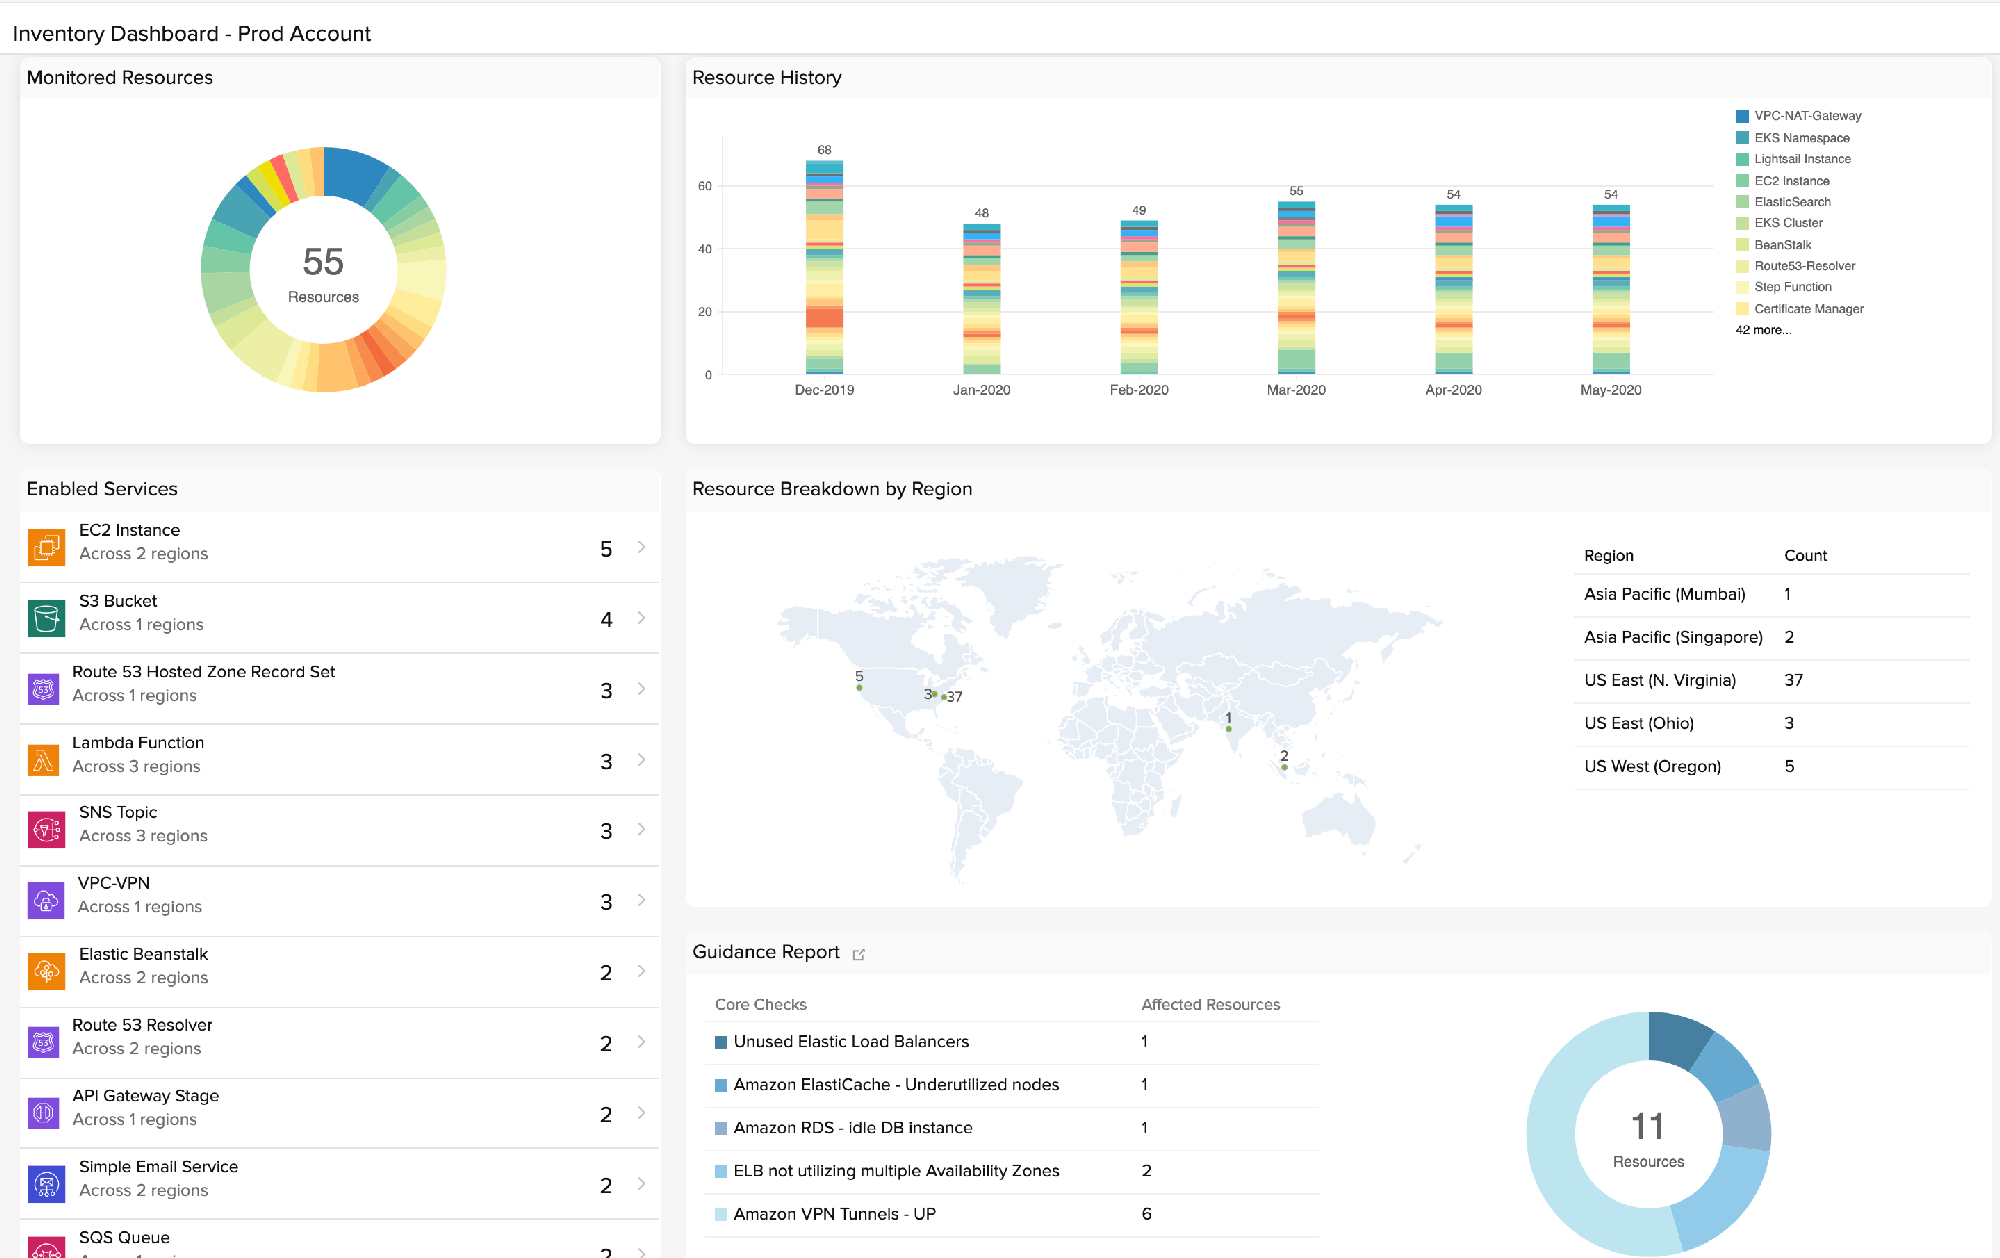
Inventory Dashboard
Get a precise picture of your self-service cloud usage. View a breakdown of monitored resource type count across your AWS account, and see how each resource type has evolved over a particular period. For example, you can compare this week's EC2 numbers with last week's to identify patterns in scaling.
Log Analytics
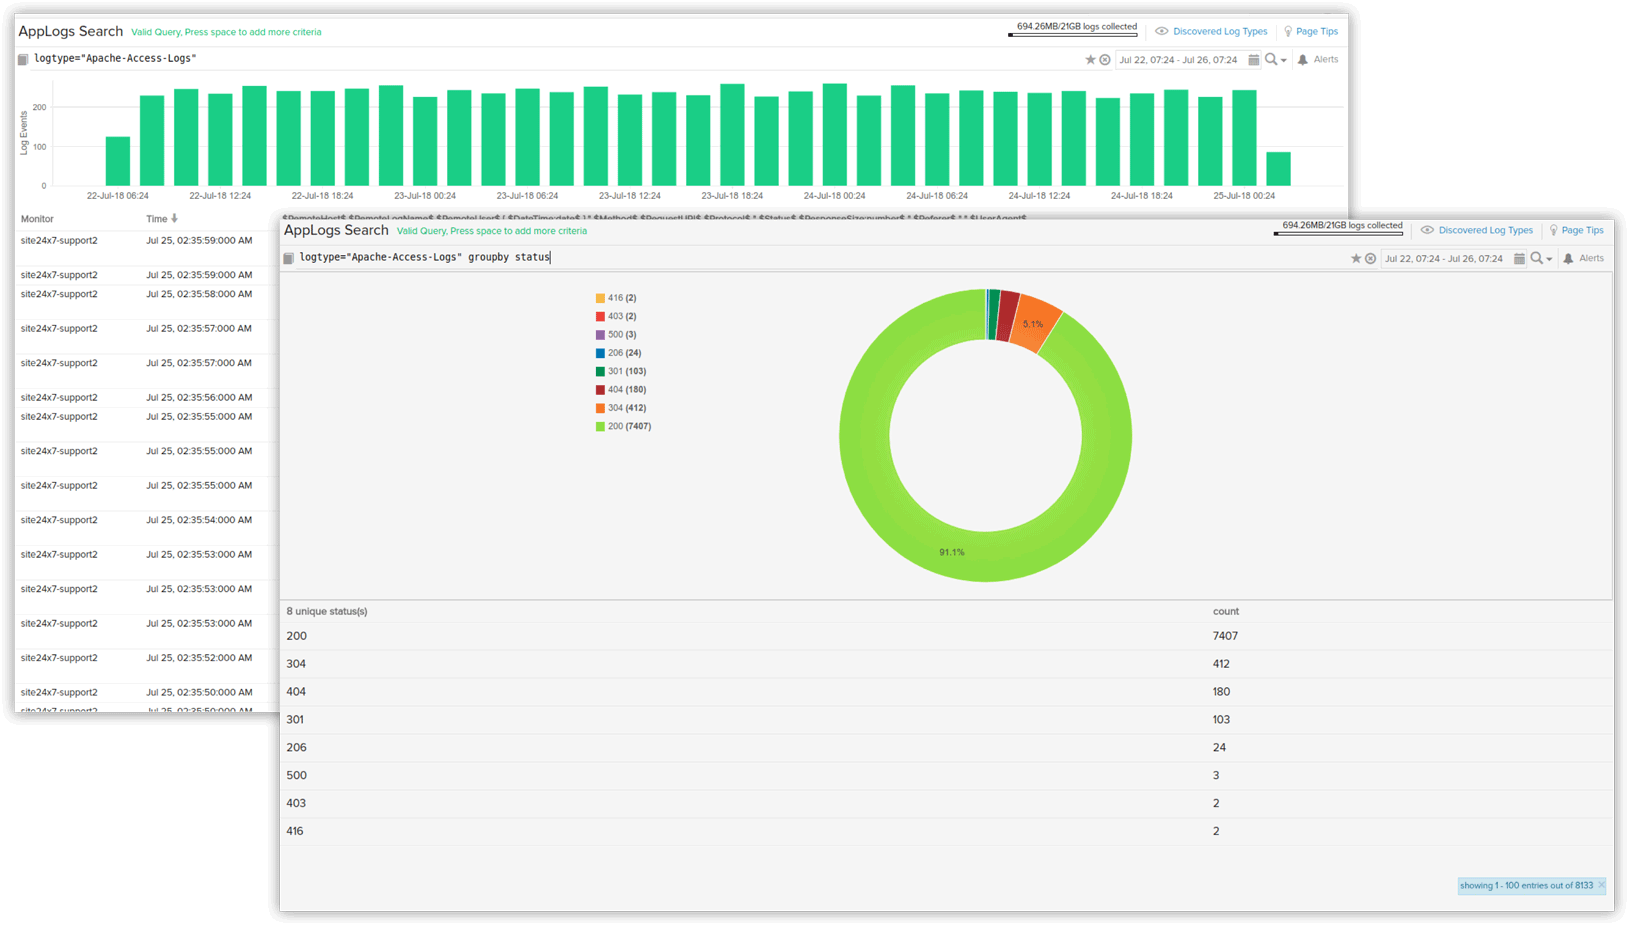
Centralize and manage AWS logs from VMs, application services and services including VPC, CloudFront and S3 buckets into a single place. Run interactive analysis using our search query language. Visualize results and configure alerts to monitor the occurrence of a specific condition or term.
Looking for a CloudWatch alternative?
If you're tired of paying CloudWatch for additional alarms, dashboards, or custom metrics and looking for an alternative, you're in the right place. Check out our detailed comparison between Site24x7's AWS Monitoring and Amazon CloudWatch.
Proactive AWS monitoring tools for service providers
AWS Managed Service Partners can avail our full-stack monitoring capabilities as a value-added service to help customers optimize their production workloads running in on-premises and multi-cloud platforms. Achieve your remote monitoring needs (RMM) with our flexible monitoring solution.
Multitenancy
Manage multiple customers’ cloud environments with full data segregation using a single Site24x7 subscription license.
White label
Create a custom monitoring portal for each client using your company name to boost your brand and reputation.
Purely SaaS
With no hardware to buy or systems to maintain, MSPs/CSPs can concentrate on helping their customers navigate the cloud.
Secure
Site24x7 is designed to protect personal and business data, and is AICPA SOC 2 and ISO 27001 certified.

As a team of cloud architects offering solutions on the Amazon Web Services platform, we feel monitoring forms a vital aspect in delivering value to our customers. Up until then, we were using Ansible playbooks to configure CloudWatch Alarms and metrics; then we started using Site24x7, the perfect full stack monitoring partner, that provided the all-important extra layer of functionality above CloudWatch. Robust APIs, alert integrations, strong focus on AWS monitoring and a great relationship with the people at Site24x7 have helped us lower costs for customers and provided us with a satisfying experience.


