Performance Metrics of DNS Monitor
Interpret DNS Server Monitoring Results
The DNS (Domain Name System), also called the "phone book of the Internet.", resolve the domain names to their corresponding numerical IP addresses. To view the performance results of your DNS monitor, click on the configured DNS monitor listed under Site24x7 home page. The performance reports are laid out in the form of graphs, charts and tables. They help you undertake a comprehensive analysis of your DNS Server performance.
The main result page is classified into two sections:
- Response Time, which outlines the domain resolution time of the DNS server in milliseconds. This data is provided as a graphical report.
- Availability & Response Time by Location, which gives a graphical and tabular report of location based availability of the DNS Server and DNS resolution time in milliseconds.
Response Time
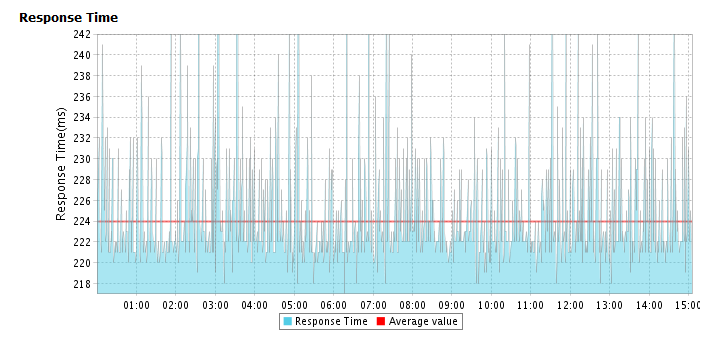
The DNS resolution time across all the configured locations for a chosen period of time is calculated and shown using a line graph. This data gives you a holistic view about the functioning of your DNS Server. Average values depend on the time period chosen for reporting.
Graphical Representation

Response Time by Location
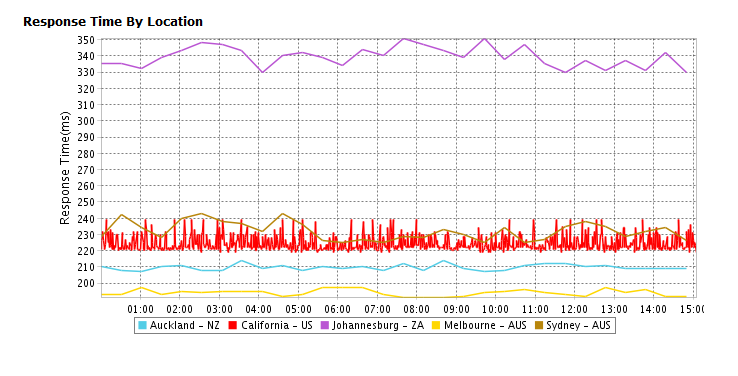
Response Time by Location graph provides the average DNS resolution time for each day or hour from every monitoring location. This data can be used to check the average response time of your monitors from different monitoring locations. Location legend is provided below the graph.

Tabular Representation
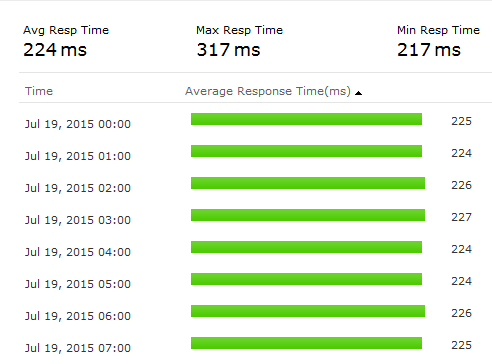
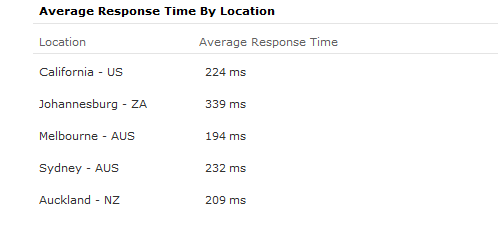
Average Response Time and Average Response Time by Location are shown in a tabular report.


Availability & Response Time by Location
Attributes like Availability and Response Time of the DNS server from each monitoring location is shown in a tabular format. The total availability (%), Response Time (ms) and down duration from each monitoring location can be inferred from this report.