Performance Metrics of MS Exchange Monitor
Interpret MS Exchange Monitoring Results
Organizational View
Organizational view gives a structural representation of servers with different roles installed under your MS Exchange deployment and shows a summary their performance status.
Organizational View can be accessed under Monitor Summary under the Home page.
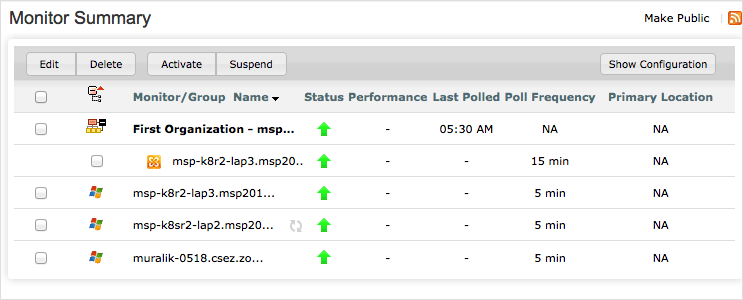

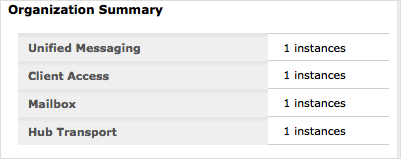
You view the performance data as attributes of the system via reports and graphs. Below are the major metrics.

Role- Mail Box
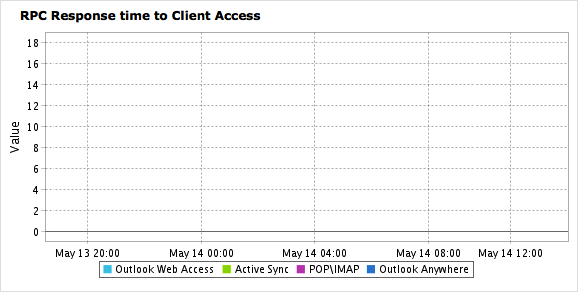
- RPC Response to Client Access - Time taken by the RPC (protocol) to contact Client Access Server.
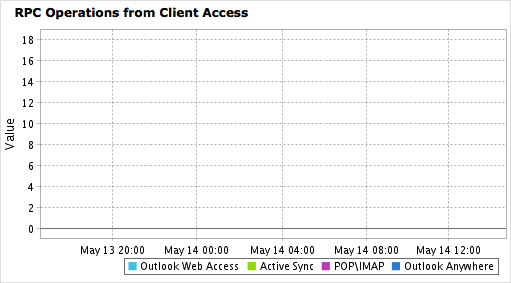
- RPC Operations from Client Access - An operation is defined as a set of processes carried out from a particular server. This counter shows the number of RPC operations from Client Access Server to Mailbox.
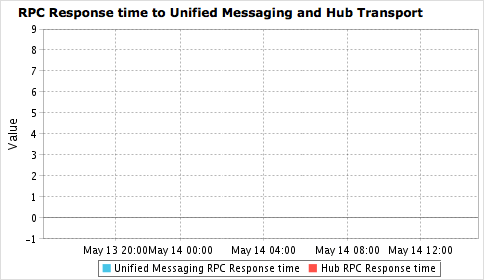
- RPC Response to Unified Messaging and Hub Transport - Shows the time taken by Mailbox server to contact Unified Messaging server and Hub Transport server.
- RPC Operations from Unified Messaging - Shows number of RPC operations from Unified Messaging to Mailbox
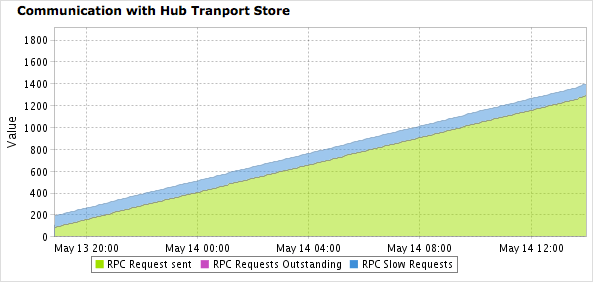
- Communications from the Hub Transport Store - Shows number of RPC requests sent and outstanding and the number of slow requests.
- Information Store
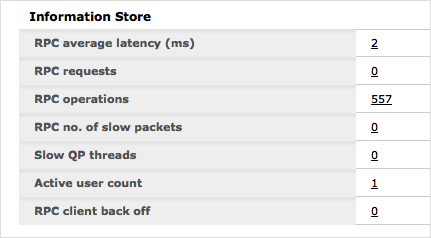
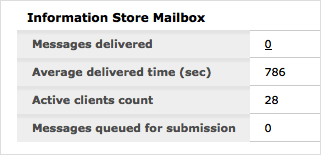
- Information Store Mailbox
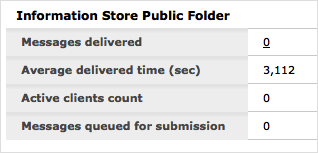
- Information Store Public Folder
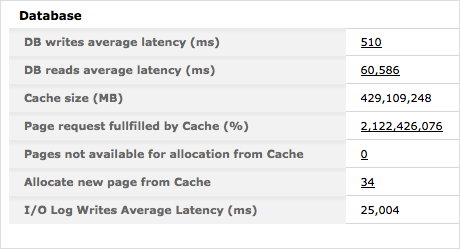
- Data Base
Role - Hub Transport
- SMTP In and Out bound - Shows data related to the inbound and outbound SMTP messages.
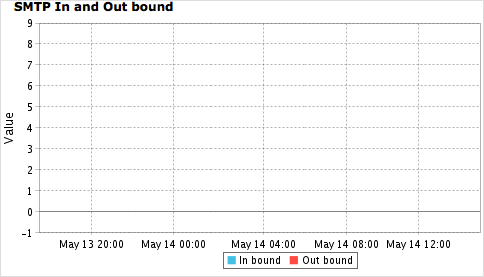
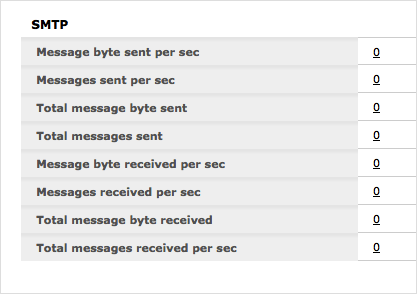
- SMTP - Shows the data related to the number of SMTP messages sent and received via the SMTP protocol. The total size sent/received as well as the number is also shown.
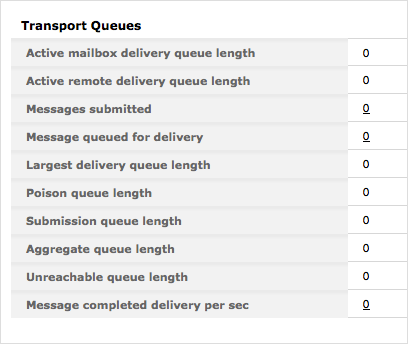
- Transport Queues - Shows counters related to number of messages in the delivery queues, the largest remote delivery queue length, aggregate queue length, unreachable queue length etc.
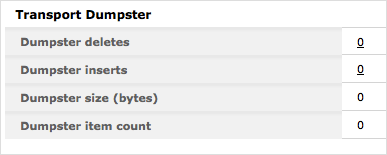
- Transport Dumpster - Shows data about the Transport Dumpster current size and usage profile.
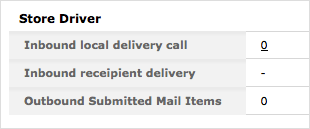
- Store Driver - Shows the number of local delivery calls per second and the mail items submitted.
Role - Client Access
- Outlook Web Access and Active Sync Response Time - Shows data related to HTTP access (Outlook Web Access) as well as time taken for the request.
- Outlook Web Access and Active Sync Requests - Active Sync requests shows the number of HTTP requests from the client per second.
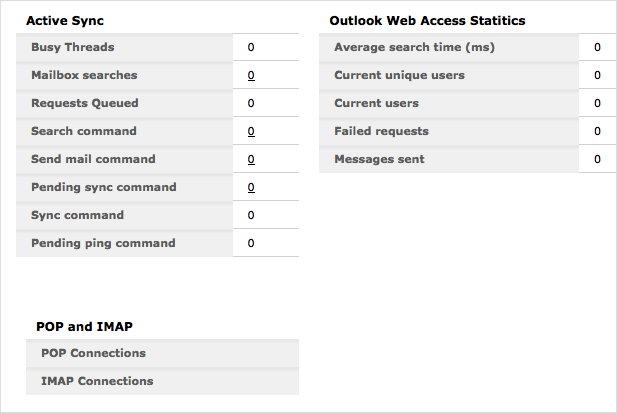
- Other counters under this section include
- Active Sync
- Outlook Web Access Statistics
- POP and IMAP
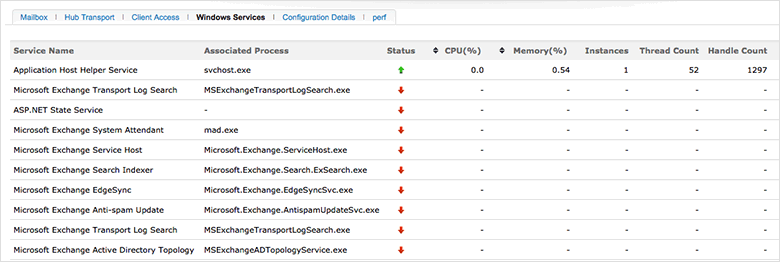
Windows Services
Shows counters related to different Windows services and associated processes running in the deployment.
Configuration Details
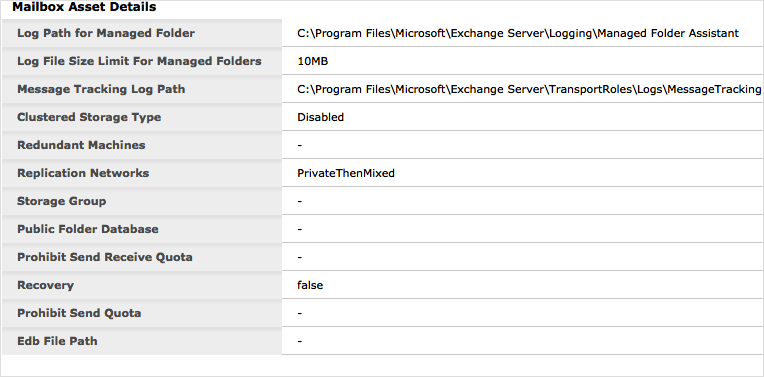
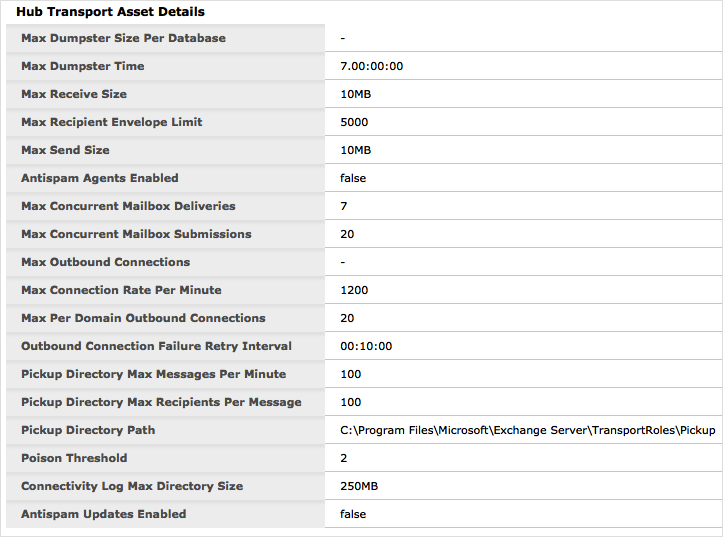
Includes asset details of Mailbox, Hub Transport and Client Access.
- Mailbox Asset Details
- Hub Transport Asset Details
- Client Access Asset Details

Create a custom dashboard view of different server metrics
User can choose and add available Metrics as a Custom View. This view will be shown as a tab and it will be available for all MS Exchange Server Monitor across the user account.

The data in the monitor details page as well as the individual report for each metric can be exported in CSV or PDF formats. Alternately they can be send via Email as well via Email or Export buttons at the right end corner of the page.