Performance Metrics of Ping Monitor
Interpret Ping Monitoring Results
Ping monitor tracks the accessibility of a specific host/IP address by performing periodic pings. It also checks for the availability of a particular server or network device. Inside the homepage, navigate to the desired Ping Monitor to view the associated metrics. The metrics are detailed in the form of graphs, charts and tables that aid you to understand and do a comprehensive analysis of the Ping performance.
The main result page is split up into two sections:
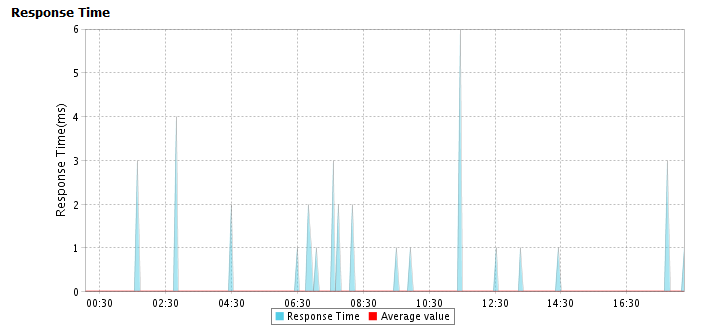
- Response Time, which shows response time metrics of Ping monitor in a graphical format.
- Availability & Response Time by Location, which gives a graphical and tabular report of location wise availability and response time of the Ping Monitor.
Response Time
Response Time of a Ping monitor is the time taken for each packet exchange between the pinger and the host server. The graph is computed by plotting time period against response time. Maximum, minimum and average response time can be estimated from this graph.
Graphical Representation

Response Time by Location
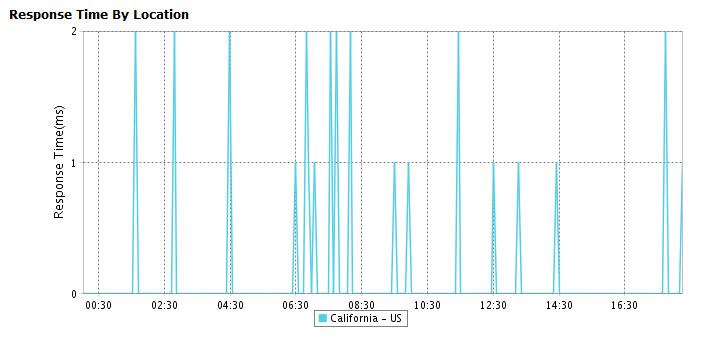
Response Time by Location graph shows the average response time of the Ping Monitor for each day or hour from every monitoring location. This graph can be employed to analyze the Average Response Time of your monitor from different monitoring locations. The location is identified using legend given below the graph.

Tabular View
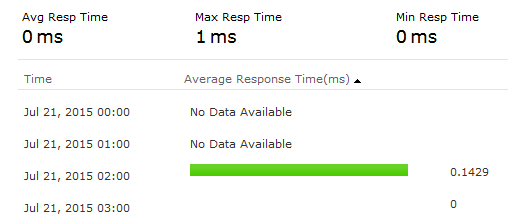
Average Response Time, Maximum response time and Minimum response time of the Ping Monitor are detailed in a tabular layout. Average Response Time By Location is defined based on the location selected.


Availability & Response Time by Location
Availability and Response Time of the Ping monitor for each and every monitoring location is shown in a tabular format. The total availability (%), and response time (ms) with down duration from each monitoring location can be inferred from this data.
