Performance Metrics of POP Service Monitor
Interpret POP Service Monitoring Results
Site24X7's POP Service monitor checks for the availability of your POP service and alerts when the response time crosses the configured threshold. To interpret the monitoring results of your POP Service Monitor, navigate to Home and click the appropriate POP Service monitor in the home screen. The results will be displayed under two main headings; Response Time and Availability and Response Time by Location. Metrics are laid out in graphical and tabular layouts.
Response Time
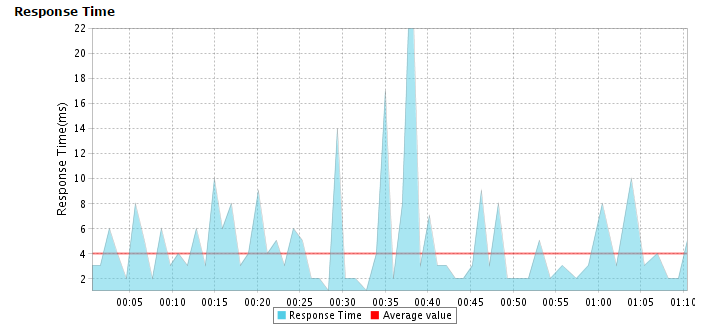
Response Time indicates the total time in milliseconds needed to connect to POP service over TCP port. The graph is computed by plotting time period against response time. Maximum, minimum and mean response time can be gauged from this graph.
Graphical Representation

Response Time by Location
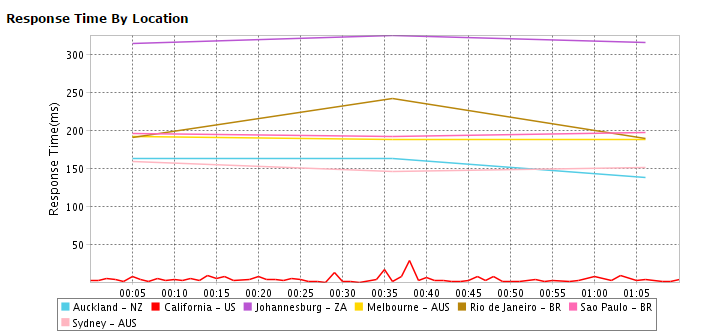
Response Time by Location graph shows the mean response time for each day or hour for each monitoring location. This graph can be employed to analyze the average response time of your monitors from different monitoring locations. Locations are identified using legends given below the graph.

Tabular Representation
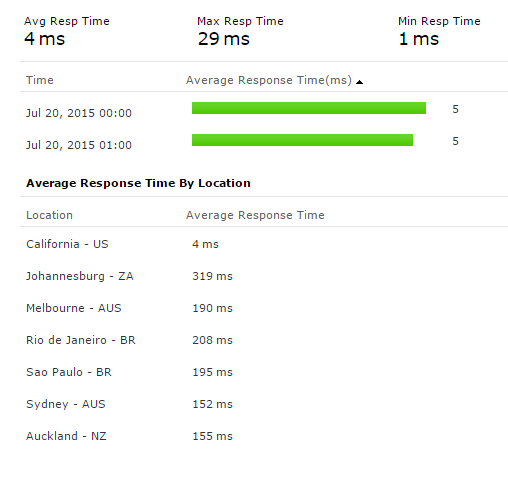
Average Response Time and Average Response Time by Location are shown in detail in a tabular layout.

Availability & Response Time by Location
Availability and Response Time of the POP server from configured monitoring locations is depicted in a tabular format. The total availability (%), Response Time (ms) and down duration from each monitoring location can be inferred from this report.
