Performance Metrics of Port Monitor
Interpret Port Monitoring Results
Site24x7 provides in-depth availability and performance monitoring of various services running on TCP/IP ports in the network. The metrics are reported in graphical and tabular layouts for easy assimilation. Historical and current data on the service performance is borne to the end user. The results are displayed under two main headers:
- Response Time
- Availability and Response Time by Location.
Response Time
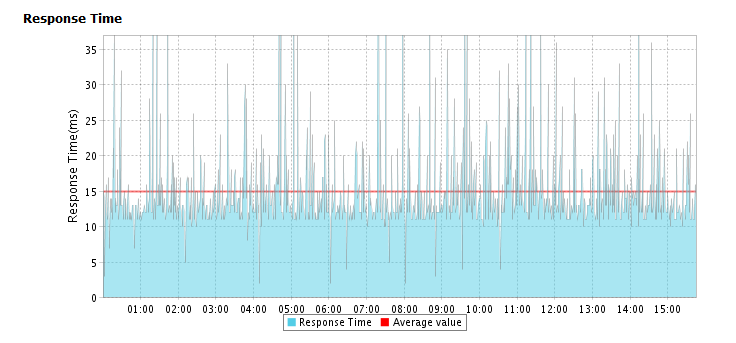
Response Time indicates the total time needed to connect to a TCP/IP Port. The graph is computed by plotting time period against response time. The crests and troughs from the graph give you a holistic view on the service performance. Average values depend on the time frame chosen for reporting.
Graphical Representation

Response Time by Location
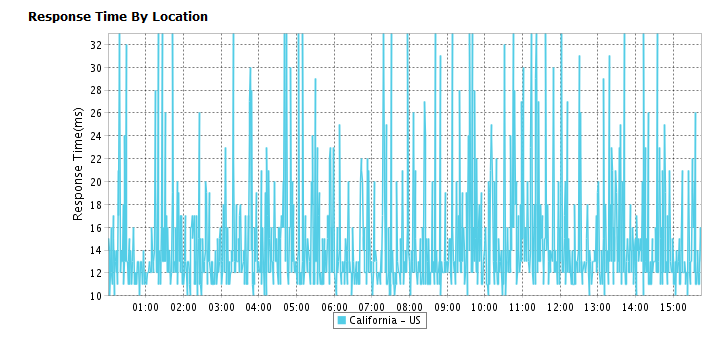
Response Time by Location graph gives the median time taken to connect to a port on each day or hour from each monitoring location. This graph can be applied to analyze the average response time of your port monitor from different monitoring locations. The Location is identified using legend given below the graph.

Tabular Representation
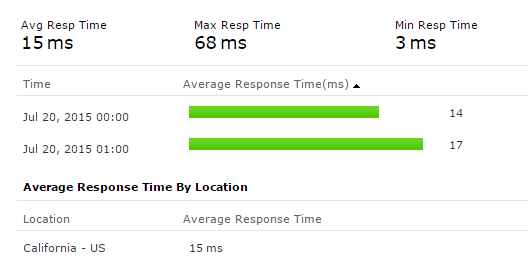
Average Response Time, Maximum Response Time and Minimum Response Time are detailed in a tabular layout. Average Response Time By Location is defined based on the location chosen.

Availability & Response Time by Location
The availability and response time of the Port for each and every monitoring location is expressed in a tabular format. The total availability (%) and response time (ms) with down duration from each monitoring location can be extrapolated from this data.
