Performance Metrics of Rest API Monitor
Interpret Rest API Monitoring Results
Site 24x7's REST API Monitor regularly tracks your API calls and simultaneously determines the response and performance of your REST APIs. Navigate to Home and click the desired REST API monitor to get an insightful analytics on the operation of your REST APIs.
The main result page is divided into three sections:
- Response Time: It is the total time taken to get a REST API response.
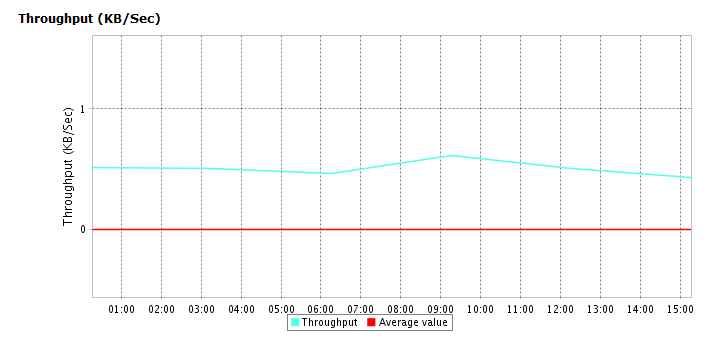
- Throughput: It is a measure of the rate (in KB/Sec) at which response is transmitted during a REST API request.
- Availability & Response Time by Location: It gives a tabular view of location wise availability and response time for a REST API request.
Response Time
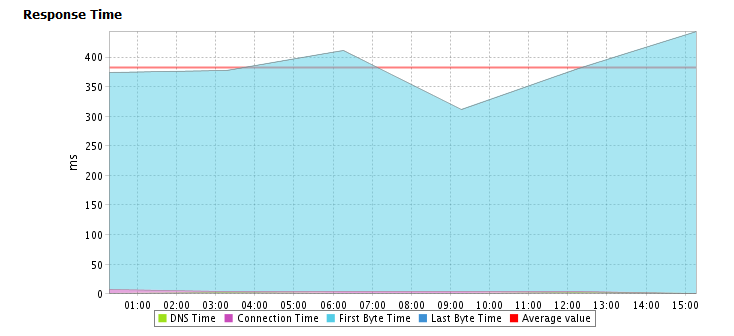
The response time of a Rest API monitor is calculated as the sum of DNS lookup time, connection time and the time contracted to receive the response in JSON or XML. The response time of your Rest API monitor across all the monitoring locations for the selected time period is calculated and shown using a line graph.
Graphical Representation

The details can be read by using the legend provided below the graph. The legend terms and their usability are explained below.
- DNS Time: DNS Time is the time taken to resolve the domain name for the request. A spike in DNS Time indicates that is taking more time to resolve the domain.
- Connection Time: Connection time is considered as the time taken by the client to establish a TCP connection with the IP address of the domain. More time to establish a connection may be due to factors such as server overloading which can be identified and addressed before it affects end-users.
- First Byte Time: First Byte time is the time from when the connection to the server established until the first response starts coming in for the base page. This is the server response time, plus network latency time. A spike in First Byte Time in your graph can indicate a delay in the processing of the request in the server.
- Last Byte Time: Last Byte Time is the time taken for the last byte of the base page to be received from the server.
Throughput
Throughput is calculated by dividing the total content length (in KB) by response time (in sec). This data is useful to analyze your connection speed as well as the bandwidth usage of the server.

Response Time by Location
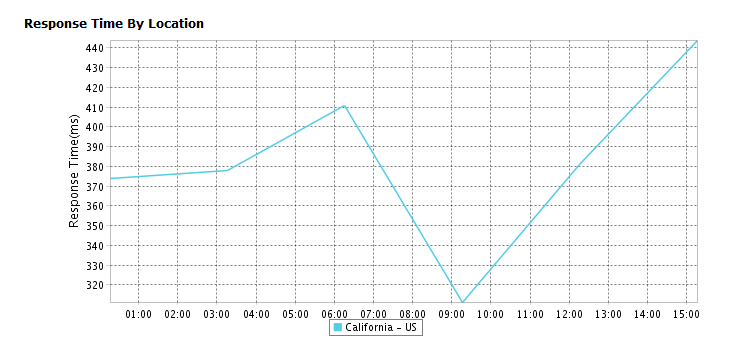
Response Time by Location graph shows the average response time for each day or hour for each monitoring location. This can be employed to check the average response time of your monitors from different monitoring locations. Location legend is rendered below the graph.

Tabular Representation
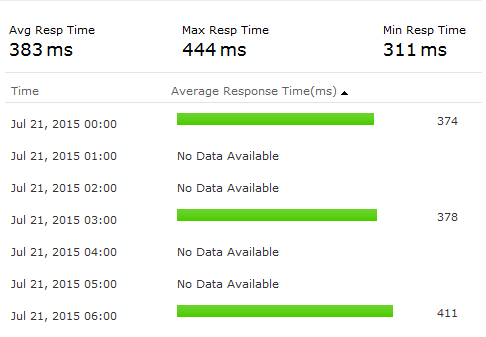
Average Response Time and Average Response Time by Location is shown in detail in the table format.


Response Time by Location
The Availability and Response time for your REST API monitor for each monitoring location is shown in a table format. The total availability (%), response time (ms) and down duration from each monitoring location can be inferred from this report.
