Performance Metrics of vCenter
Interpret VMware vCenter Monitoring Results
The configured vCenter Monitor can be accessed by navigating to Home > Monitor Details page after logging in.
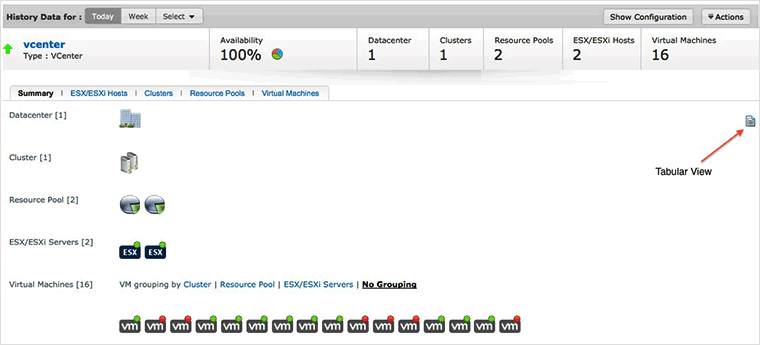
The History Data tab shows the overall availability of the Monitor and an overview of the different components of your vCenter Monitor. It also shows the number of data centers, clusters, resource pools, ESX/ESXi servers and Virtual Machines present in your vCenter server. Using History Data, details can be viewed for the current day, week or for a custom time period by selecting the drop down.
Summary Tab
The Summary tab gives a data snapshot of clusters, data centers, resource pools, ESX/ESXi server and Virtual Machines configured in your vCenter server.

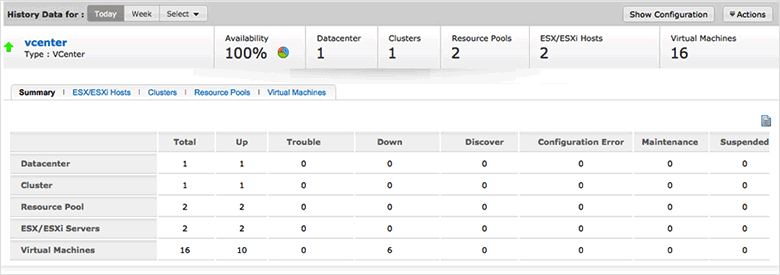
The vCenter Summary is also shown in a table format as below on clicking the Table View icon.

Datacenters
If your vCenter has data centers configured, the details can be viewed by clicking the the data center icon. You can view the Data center info and the availability of its underlying components such as Clusters.
Clusters
View the summary of Clusters and the availability of the underlying components such as ESX/ESXi hosts, VMs, etc.
Resource Pool
Correlated performance metrics of the Resource Pool is displayed. You can monitor and thus pro-actively manage your server’s current CPU, Total Memory usage, number of
Data Stores reservation and allocation statistics. This data can be used to re-allocate or organize resources for the server or cluster accordingly.
ESX/ESXi Servers
The Summary page shows the number of ESX/ESXi servers configured in your vCenter monitor. Click the individual ESX/ESXi severs to see the detailed information regarding each server. The metrics such as availability, CPU and Memory utilization and details of the Virtual Machine will be captured here.
Virtual Machines
The number of virtual machines in your vCenter server. All the VMs available under the vCenter server will be shown here. Click the individual Virtual Machines to get the detailed information of each Virtual Machine.
The VMware vCenter servers are monitored based on the parameters or the attributes listed below. These attributes provide detailed information about the functioning of the monitors of vCenter server. Thresholds can be configured based on these monitoring data.
| Metrics |
Description |
| ESX/ESXi Host / Virtual Machine Details |
|
| Name |
The name of VMware ESX/ESXi server monitor |
| Datacenter |
The name of the Datacenter to which the ESX host belongs |
| Cluster |
The name of the cluster to which the ESX host belongs |
| CPU(%) |
The CPU utilization of the ESX/ESXi host in percentage |
| Memory (%) |
The percentage of memory used across the ESX/ESXi host |
| Network (kbps) |
The network usage of the ESX/ESXi host in kbps(kilobytes per second) |
| Disk I/O (kbps) |
The disk usage of the ESX/ESXi host in kbps(kilobytes per second) |
| Cluster Details |
|
| Cluster Name |
The name of the vCenter cluster |
| Datacenter |
The datacenter to which this cluster belongs |
| Effective CPU |
Effective memory resources (in MB) available to run virtual machines. This is the aggregated effective resource level from all running hosts. |
| CPU Cores |
The number of physical CPU cores. Physical CPU cores are the processors contained by a CPU package. |
| CPU threads |
The aggregated number of CPU threads. |
| Tolerated Failover |
Number of failures that can be tolerated by the VMware HA. |
| Memory Utilization |
The percentage of memory used across the cluster. |
| Consumed Memory |
The memory utilized so far (in MB). |
| Total Memory |
The amount of memory used by this cluster |
| Effective Memory |
Effective memory resources (in MB) available to run virtual machines. This is the aggregated effective resource level from all running hosts. |
| Active Memory |
The amount of memory that is actively used measured in Mhz. |
| Swap Memory |
The amount of memory that is swapped. |
| Resource Pool Details |
|
| Overall CPU Usage |
The total amount of CPU resources utilized measured in Mhz. |
| Maximum CPU Usage |
The maximum amount of CPU resources utilized measured in Mhz. |
| CPU Reservation |
The amount of CPU resources reserved for a virtual machine measured in Mhz. |
| CPU Allocation Limit |
The amount of CPU resources allocated to a virtual machine measured in Mhz. |
| Overall Memory Usage |
The total amount of RAM being used by a virtual machine measured in MB. |
| Maximum Memory Usage |
The maximum amount of RAM that can be used by a virtual machine measured in MB. |
| Memory Reservation |
The amount of RAM reserved for a virtual machine measured in MB. |
| Memory Allocation Limit |
The amount of RAM allocated to a virtual machine measured in MB. |