Performance Metrics of Web Application (Real Browser)
Interpret Web Application (Real Browser) Monitoring Results
Web Application (Real Browser) Monitor displays the performance metrics in an easy to understand layout. The metrics section are neatly organized into graphs and charts for easy assimilation.
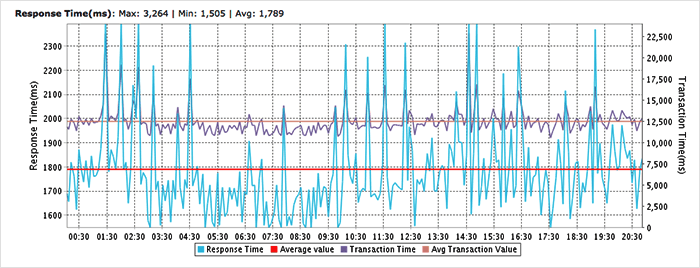
Response Time graph - Shows the average response time on a hourly/daily/weekly/monthly basis, based on the time period you have chosen. The metrics included are
- Response Time
- Average Value
- Transaction Time
- Average Transaction Value

The time period can be chosen from the History Data for section.

Current Screenshots of Steps - Shows the most recent screenshots of all the steps captured during the transaction.
You can browse through the different steps by clicking the counters below. On the immediate right, against the screenshots screen shows you the corresponding Step Name, URL and the Response Time for that particular URL. Clicking on Screenshot History will take you to more details information.

Transaction Time for Steps by Location - Shows you the location wise, time taken to complete a transaction for each of your recorded steps.
