Performance Metrics of Web Page Analyzer
Interpret Web Page Analyzer Results
Web page analyzer displays your website performance in an easily understandable format. The result page can be sub-divided into five sections:
History Data
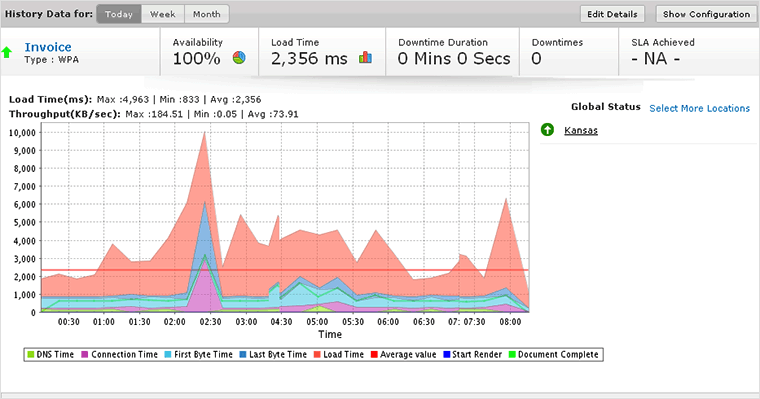
This section displays the historical information your website performance along with the availability, response time, load time, downtime duration, number of downtimes and SLA violation. The graph displays the response time of various factors such as DNS Time, Connection Time, First and Last Byte Time, etc. It also shows you the maximum, minimum and average load times (in milliseconds) of the webpage configured along with its Throughput values (in KB/sec). It also displays the global availability of the web page, if configured.

The details can be read using the legend given under the graph. These legend details are explained in detail below.
- DNS Time: The DNS Time is the time taken to resolve the domain name for the request. A spike in DNS Time indicates that is taking more time to resolve the domain.
- Connection Time: The connection time is considered as the time taken by the client to establish TCP connection with the IP address of the domain. More time to establish a connection may be due to factors such as server overloading which can be identified and addressed before it affects end-users.
- First Byte Time: The First Byte time is the time from when the connection to the server established until the first response starts coming in for the base page. This is actually the server response time plus network latency time. A spike in First Byte Time in your graph can indicate a delay in the processing of request in the server.
- Last Byte Time: Last Byte Time is the time taken for the last byte of the base page to be received from the server. An increase in the Last Byte Time in your Response Time Graph indicates an extra amount of content transfer that may be happening during the request or due to low bandwidth available for content transfer.
- Load Time: Load Time is considered as the total time taken to load the complete content of the response. Practically this is equal to the Document Complete time that is explained below.
- Start Render: The Start Render time is the time when some relevant portion of the webpage starts loading in the browser window. (i.e. the point at which the user is no longer seeing a blank white window).
- Document Complete: Document Complete is the point where the page has finished loading the entire content. At this point the page is ready for user interaction.
Response Time Summary
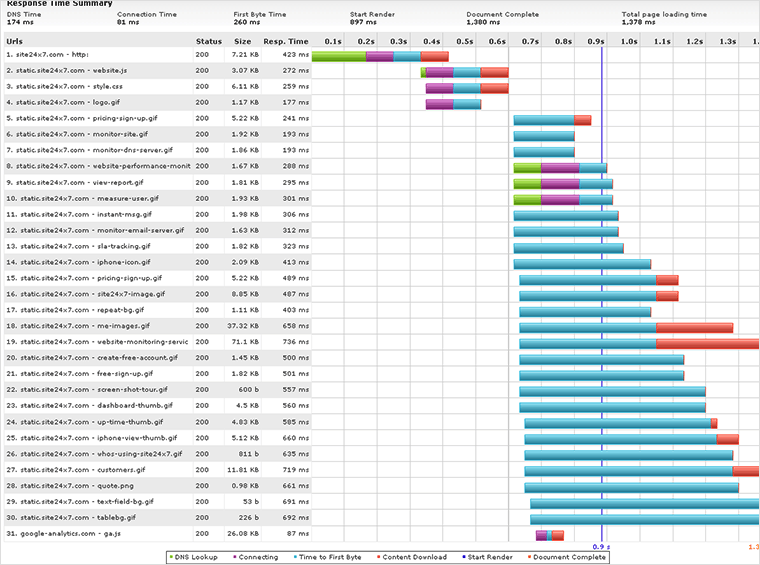
Response time details for web page elements like HTML, JavaScript, CSS, images etc. is shown in a waterfall model under this section. Status code, size and response time of each element is shown in detail along with breakup of the response time. This breakup includes DNS lookup time, connection time, first byte time, content download time, render start time and document complete time.

Webpage Summary
This section displays summary of all the elements of the web page that is being checked using real browsers. This summary will include number of requests sent before the page has finished loading, total number of objects in the page and the number of images, JavaScript and CSS included in the objects. This will also include the total size of the web page. Two pie charts; Content Breakdown by Requests and Content Breakdown by Size are displayed in the summary of the web page.
Webpage Summary section will also show a screenshot of the webpage that is analyzed.

Domain Summary
This section will show you the number of requests sent for each of the domains under a particular URL and the response time for each of those domains. For example, under the URL www.mysite.com, images are loaded from images.xyz.com, advertisement banners are loaded from ads.sample.com and so forth. Number of requests sent to each of these domains and the response time taken by each of them is elaborated in domain summary section.
Other details that are included are size (KB) of each domain, average response time (in milliseconds) for each request and the average throughput value (content length/response time).

Availability and Response Time by Location
Location wise Availability (%), Response Time (ms), Downtime Duration, number of Down times and Last Downtime details will be shown in table format. All the chosen locations will be included under Location.
