Performance Metrics of Website Monitor
Interpret Website Monitoring Results
Navigate to Home and click the desired website monitor to view the corresponding monitoring details. This page has different graphs, charts and tables that help you to do a comprehensive analysis of your website performance.
The main result page is divided into two sections; Response Time which shows response time metrics of your website in a graphical format and Availability & Response Time by Location, which gives a tabular view of location wise availability and other related metrics.
Response Time
Response time of a URL monitor is calculated as the sum of DNS lookup time, connection time and the time taken to download the entire HTML content of the web page. The response time of your website monitor across all the monitoring locations for the chosen time period is calculated and shown using a normal line graph. Maximum, minimum and average response time can be gauged from this graph. Average values depend on the time period chosen for the monitoring.
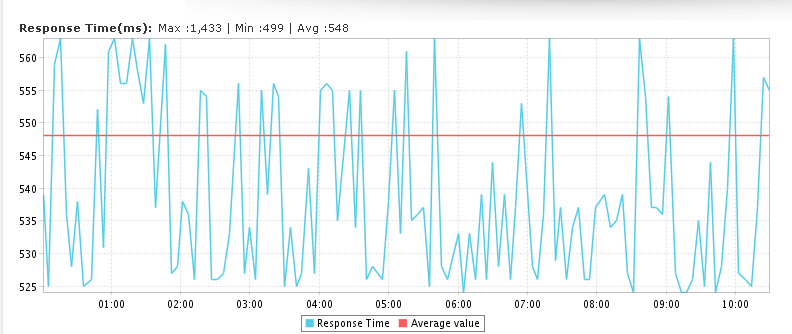
Graphical View
Response Time Graph
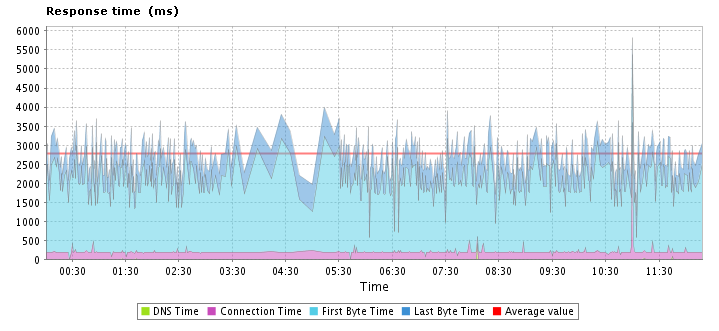
The details can be read using the legend given below graph. Each of the legend terms as well as their usability is explained below.
- DNS Time: The DNS Time is the time taken to resolve the domain name for the request. A spike in DNS Time indicates that is taking more time to resolve the domain.
- Connection Time: The connection time is considered as the time taken by the client to establish TCP connection with the IP address of the domain. More time to establish a connection may be due to factors such as server overloading which can be identified and addressed before it affects end-users.
- First Byte Time: The First Byte time is the time from when the connection to the server established until the first response starts coming in for the base page. This is actually the server response time plus network latency time. A spike in First Byte Time in your graph can indicate a delay in the processing of request in the server.
- Last Byte Time: Last Byte Time is the time taken for the last byte of the base page to be received from the server. An increase in the Last Byte Time in your Response
- Time Graph indicates an extra amount of content transfer that may be happening during the request or due to low bandwidth available for content transfer.
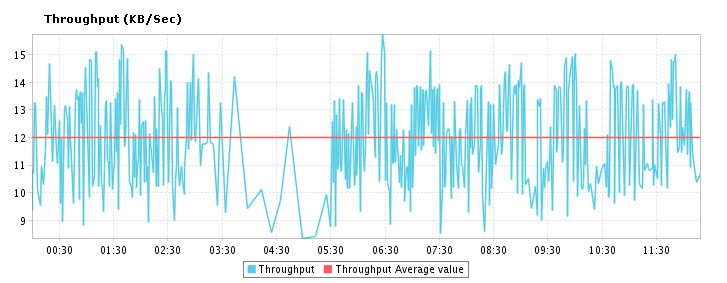
Throughput Graph
Throughput is calculated by dividing the total content length (in KB) by response time (in sec). This data is useful to analyze your connection speed as well as the bandwidth usage of the server.
Response Time by Location
Response Time by Location graph shows the average response time for each day or hour from each monitoring location. This can be used to check the average response time of your monitors from different monitoring locations. Location legend is given below the graph.
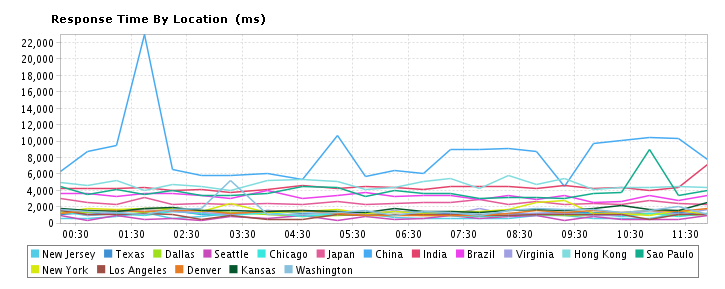
Table view
Average Response Time and Average Response Time by Location is shown in detail in the table format.
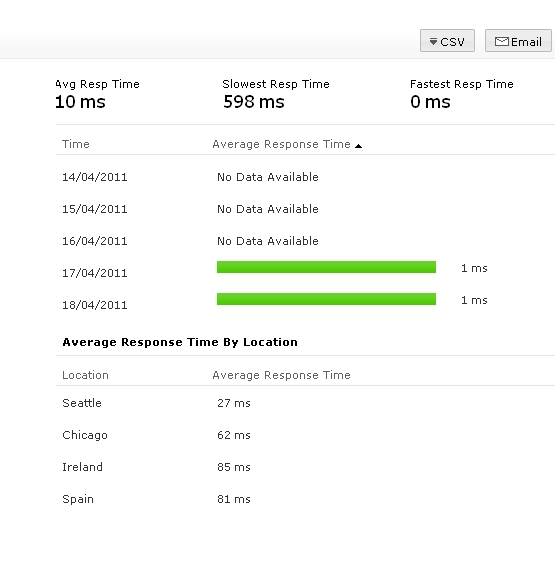
Availability & Response Time by Location.
The availability and response time for your configured URL for each monitoring location is shown in a table format. The total availability %, and response time and down duration from each monitoring location can be viewed from this.

Downtime Instance Screenshot
A screenshot is taken whenever a downtime is detected and confirmed. Using this option you can see what exactly your website returned for the end-user, when Site24x7 reported your website as down. This option helps you to isolate and resolve issues faster.
To get a screenshot of a downtime,
- Navigate to Home
- Click a URL monitor that is displayed as down (shown using a red downward arrow)
- In the monitor details click the small black camera icon that is placed at the right hand side of the History Data section.

- The screenshot for that particular downtime instance will open in a separate window.
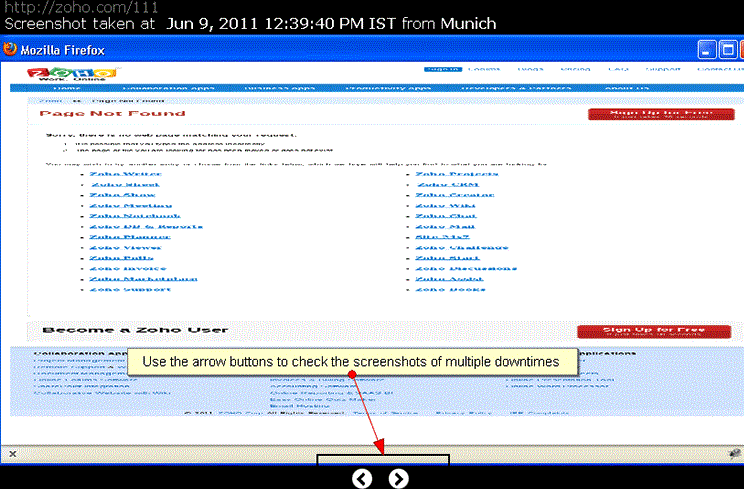
Website Response for Content Mismatch
When ever a content mismatch occurs Site24x7 will be showing that monitor in 'Trouble' status. You have the option to view the HTML response of the webpage during that instance.
To view the HTML response
- Navigate to Home
- Click a URL monitor that is shown in 'Trouble' status (shown using an Orange upward arrow
- Under the History Data section, click the small button labelled 'HTML', that is placed under 'Trouble' reason string.

- The HTML response at the time of content mismatch will be shown.
