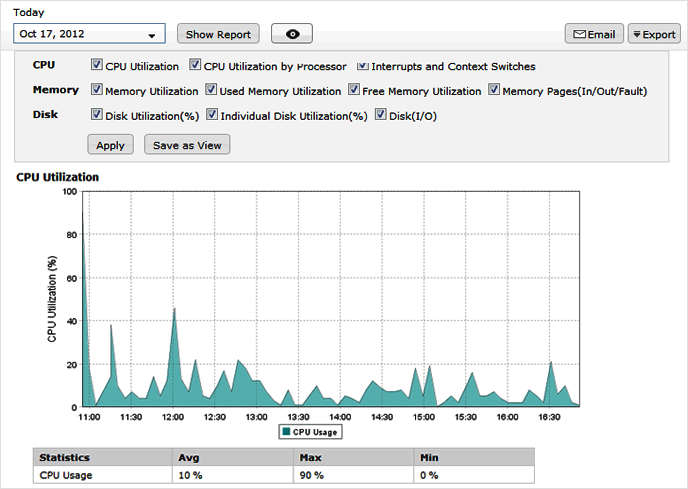
Performance Metrics of Windows Server Monitor
Interpret Windows Server Monitoring Results
You can view all the details about your server monitor under monitor details page. Inside the home page, click on your server monitor to access the monitor details page.
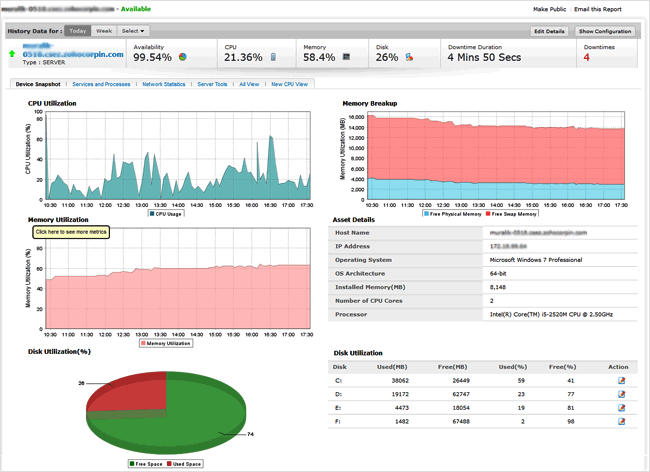
Detailed view of each metric
Clicking on individual charts in the details page will open up a more detailed view of the corresponding metric. Reports can be generated for different time periods by choosing the appropriate value from the drop down. You can also export these reports as CSV/PDF or send via Email.
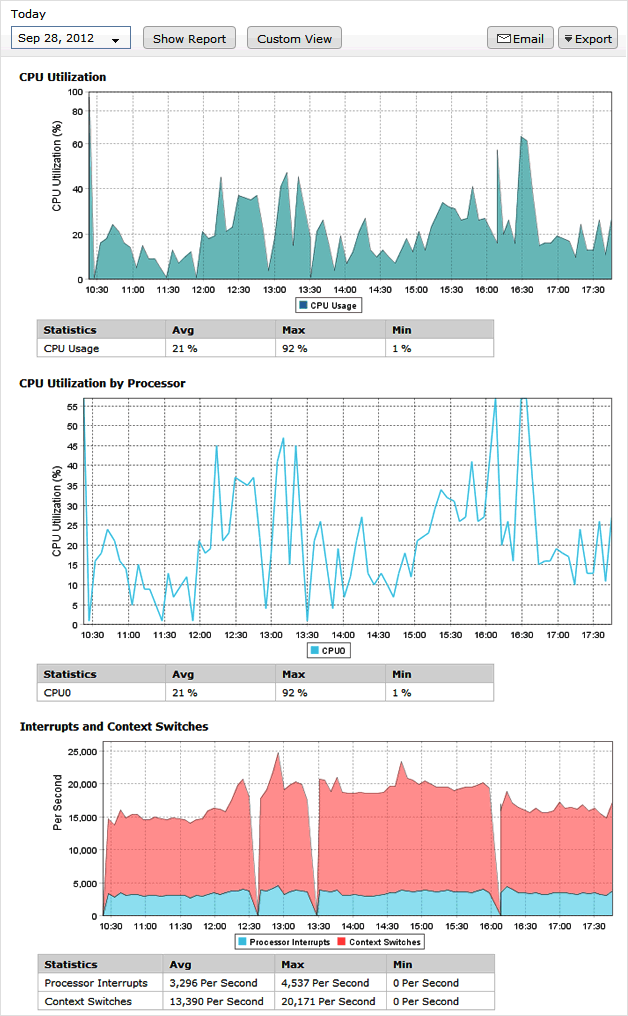
CPU Utilization
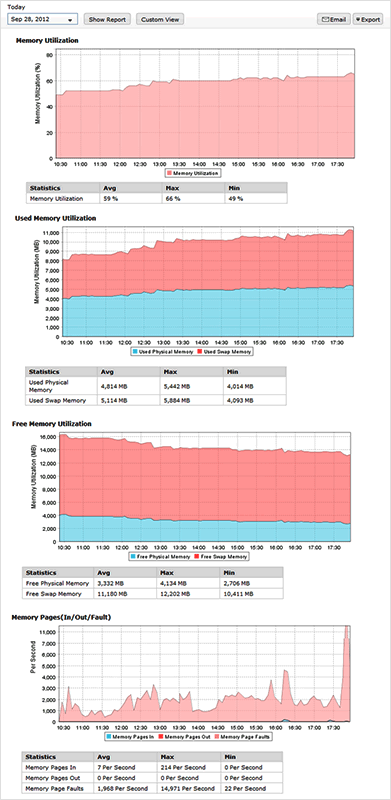
Memory Utilization
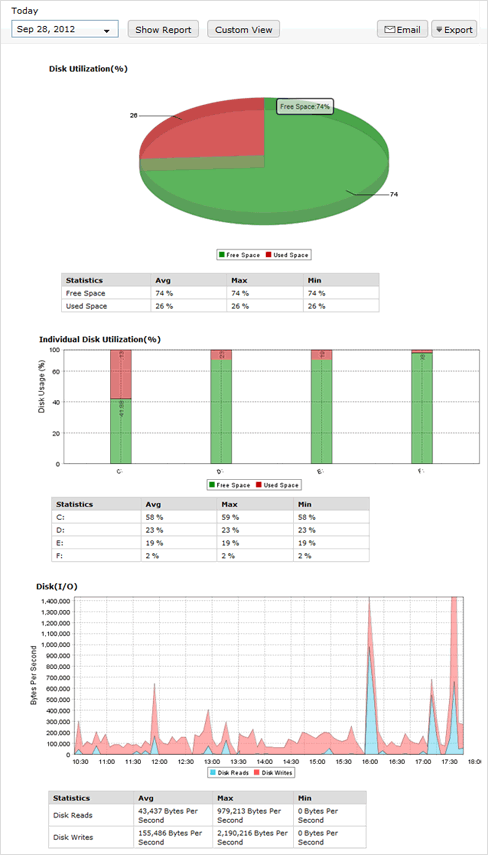
Disk Utilization
Processes & Services
- Availability status of Windows services and Processes can be monitored using server monitoring feature.
- Click Services and Processes tab in the server monitor details page to view the details

Network Statistics
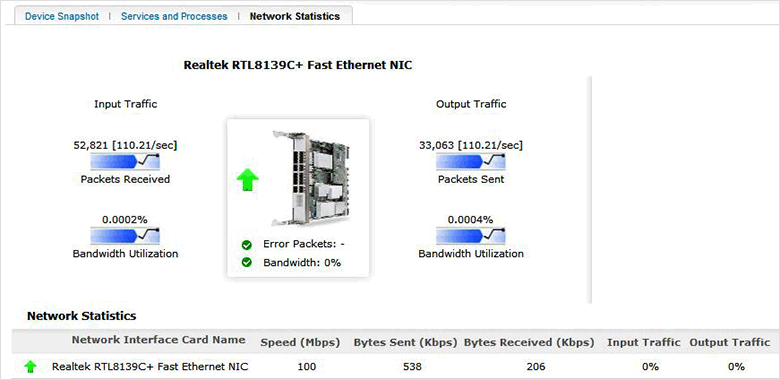
Network statistics gives a detailed view about the input and output traffic along with the bandwidth utilization for both input and output utilization. You can also get to know the speed of our Network Interface Card.
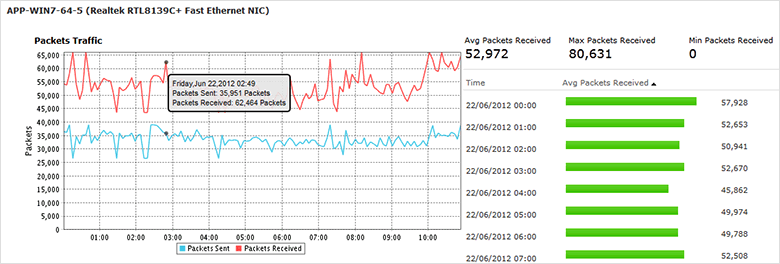
Clicking on the individual input or output traffic will generate a Packets Traffic Report which will have details about packets sent and received.
Additional performance metrics added to server monitor.
The following additional metrics can be inferred from the server monitor page.
- Memory Page Fault: A page fault occurs when a process requires code or data that is not in its working set (its space in physical memory).
- Memory Page In: Number of pages read from disk to resolve hard page faults.
- Memory Pages Output: Number of pages written to disk to free up space in physical memory.
- Processor Interrupts: Average number of hardware interrupts that the processor is receiving.The devices like system clock, mouse, disk drivers, data communication lines, network interface cards, and other peripheral devices normally interrupt the processor when they have completed a task or require attention.
- Context Switches: Rate of switches from one thread to another. Thread switches can occur either inside of a single process or across processes.
- Disk Reads: Bytes of data read from the disk.
- Disk Writes: Bytes of data written to the disk.
Add a custom view
User can choose and add available Metrics as a Custom View. This view will be shown as a tab and it will be available for all Server Monitor across the user account.
