Downtime Report
Downtime Report from Site24x7 shows you the overall and location-wise downtime information about your Monitors. Downtime Report is displayed in the alphabetical order of your configured Monitors.
Generate your Downtime Report
- Navigate to Reports > Downtime Report.
- Select the appropriate monitor from the pull down menu Monitors and choose the desired time period.
- Click Show Report to generate Downtime Report.
Read your Downtime Report
- For ease of comprehension Downtime Report is presented in two separate formats.
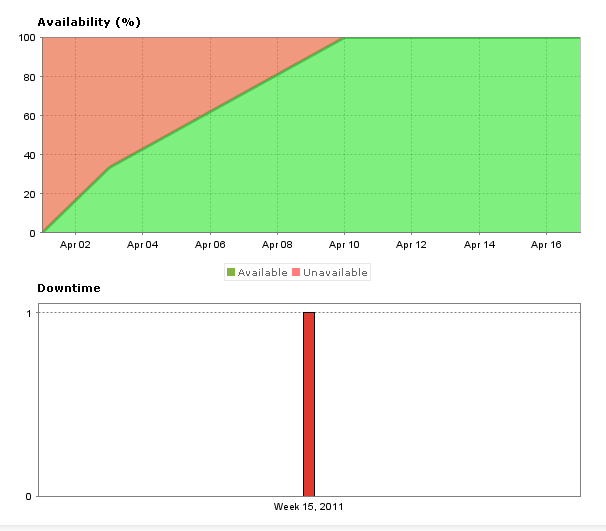
- A graphical format which presents the availability percentage and downtime value.
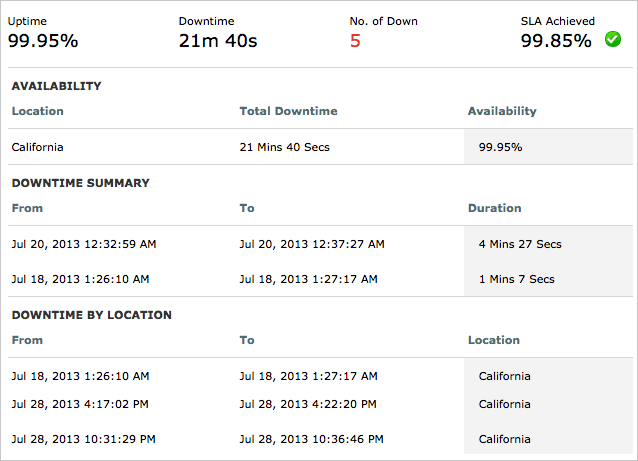
- A tabular format that displays the overall up time, downtime information in milliseconds, number of downtime, and whether or not SLA has been achieved for the monitor in question. In this format, the availability and downtime graphs are pretty simple to read and analyze.

- In the tabular format, the availability is shown based on different locations configured for the monitor, the total downtime and total availability for the location concerned. It also displays a downtime summary, where it shows the information such as duration of the downtime occurred (from and to) and its duration in 'days:hours:minutes:seconds format'.
