Performance Report
Performance Report shows the availability and response time of your configured monitors with respect to various monitoring locations. By generating a Performance Report, it is easier to drill deep into the performance of the configured monitors from various monitoring locations. This also can help identify monitors with poor response time and take corrective measures where ever necessary. The average time taken by the monitors to respond to Site24x7 servers, over a specific time period is also shown.
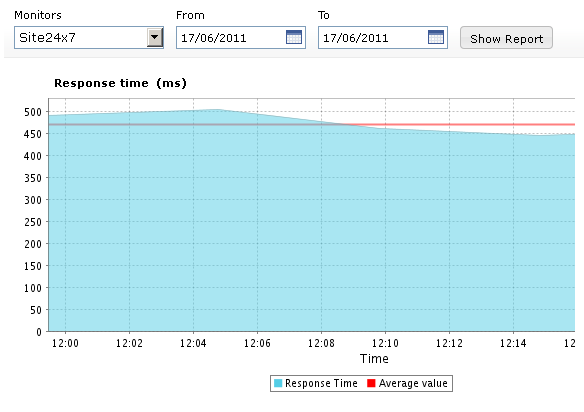
- Response time and Average Response Time data is useful to check the performance of your monitors over a period of time. You can use this data to fine tune your web page. You can use this date to fine tune your webpage.
- Response Time graphs provides split up based on DNS Time, Connection Time, First Byte and Last Byte times. This is a more objective analysis that helps you identify the bottle-neck for your performance problems.
- Throughput or average content download speed can be used to determine the bandwidth usage of the server. Throughput metrics can also help to ensure that your ISP networks are performing consistently throughout.
- Response Time by Location shows you the response time of your monitor from multiple locations. This data will help you understand if there are any ISP specific reasons that are preventing your users from reaching your website. For example, If your service provider has issues accessing websites in the UK and your UK based website is targeted at an India specific audience, you need to know that beforehand so that you can contact the service provider and inform them about the problem.
Generate Performance Report
- Navigate to Reports > Performance Report.
- Select the required monitor or monitor group from Monitor/Groups tab and a time period using the date fields.
- Click Show Report to generate your Performance Report. The Resp can be exported as a CSV file or send via e-mail using the buttons CSV and Email at the top right corner of the report page.

Read your Performance Report
Interpreting your Performance Report is simple and easy. Below are two use cases presented for your easy understanding.
Case 1:
Individual monitor chosen under Monitor/Groups drop down list.
When an individual monitor is chosen to generate Performance Report, results will be displayed in both tabular and graphical formats. Report for individual monitor can be generated when you wish to have a detailed report on the performance of your configured monitors. Report will be displayed in both graphical and tabular views.
Both views are analyzed in detail below.
Graphical View
Response Time Split Graph
For illustration purposes, response time graph for a URL monitor is analyzed.

In the above graph, response time for the monitor 'test' is generated for a time period of 18 days. The details include DNS time, connection time, first byte time, last byte time and the average value. These details can be read using the legend given below graph. Each of the terms as well as their usability is explained below.
- DNS Time: The DNS Time is the time taken to resolve the domain name for the request. A spike in DNS Time indicates that is taking more time to resolve the domain.
- Connection Time: The connection time is considered as the time taken by the client to establish TCP connection with the IP address of the domain. More time to establish a connection may be due to factors such as server overloading which can be identified and addressed before it affects end-users.
- First Byte Time: The First Byte time is the time from when the connection to the server established until the first response starts coming in for the base page. This is actually the server response time plus network latency time. A spike in First Byte Time in your graph can indicate a delay in the processing of request in the server.
- Last Byte Time: Last Byte Time is the time taken for the last byte of the base page to be received from the server. An increase in the Last Byte Time in your Response Time Graph indicates an extra amount of content transfer that may be happening during the request or due to low bandwidth available for content transfer.
The response time split for DNS time, Connection Time, First Byte Time and Last Byte Time will be applicable only for URL monitors and Webpage Analyzer monitors only. For rest of the monitors (example Ping monitor, Port monitor or DNS monitor etc.) only the response time along with the average response time will be shown.
Throughput Graph
Throughput is calculated by dividing the total content length (in KB) by response time (in sec). This data is useful to analyze your connection speed as well as the bandwidth usage of the server.
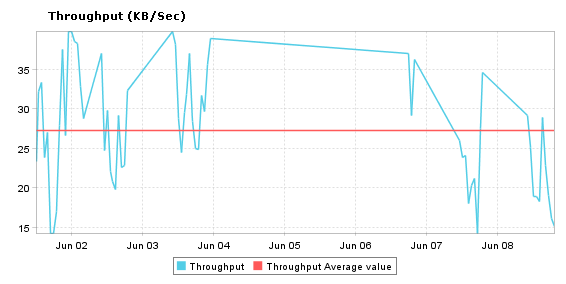
Throughput data will be shown only for monitors where content download happens. That means, Throughput graph is generated only for URL and Webpage Analyzer monitors.
Response Time by Location Graph
Response Time by Location graph shows the average response time for each day or hour from each monitoring location. This can be used to check the average response time of your monitors from different monitoring locations. Location legend is given below the graph.
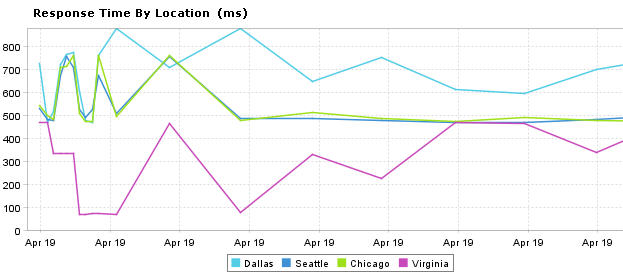
Table View
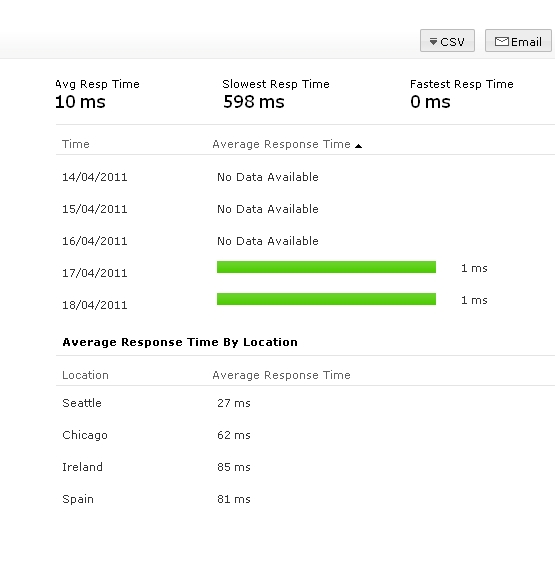
Average Response Time and Average Response Time by Location is shown in detail in the table format.
Case 2:
Option All chosen under Monitor/Groups drop down list.
When option All is chosen, results will be displayed in table format only. This view can be chosen when you want to have a quick, objective view of the performance of your monitors.
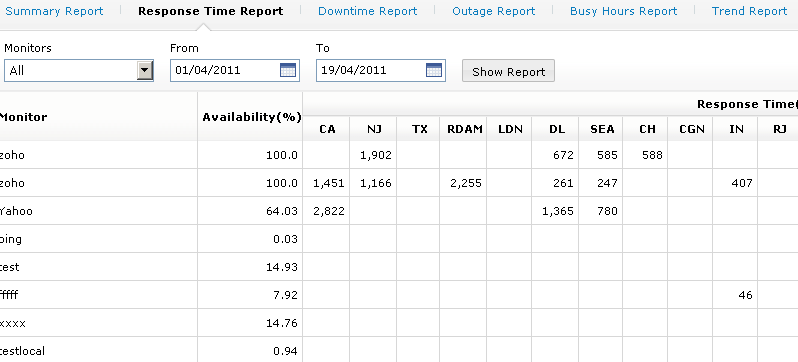
If the time period chosen is within 24 hours, results will be displayed in a per hour breakup. If the time period chosen is outside 24hours, data with day wise break up will be shown.