Summary Report
Summary Report is a collective report that highlights average response time and overall availability of your configured monitors through a chosen time period. In a real-time business scenario, Summary Report helps you to have bird's-eye view of the overall performance of your configured monitors.
This report shows you metrics such as average response time, overall availability, number of downtime and duration of each downtime. Summary Report has a separate section that discusses the availability summary of individual monitors.
- The Overall Availability and Average Response Time metrics gives an overall picture of the key performance indicators such as up time and performance for your websites and servers, over a period of time.
- The Availability Report that can be generated for individual monitors supports data such as availability summary, start and end times of a downtime along with the duration and reason for downtime. This facilitates a more deep analysis of the performance of your monitors over a period of time.
- The Compare option allows you to get a clear perspective of the performance of different monitors and identify areas that need improvement.
Generate a Summary Report
- Navigate to Reports > Summary Report.
- You can filter out and see the Summary Report based on following criteria:
- Monitors/Groups: Select the desired monitor or monitor group from the drop down list.
- Time Period: Choose the required time period.
- Click Show Report to generate Summary Report. Once the report is generated you can export it as a CSV file by clicking the CSV button or send as e-mail by clicking the Email button at the top right corner of the report page.
Read your Summary Report
- Summary Report for your monitors is displayed in an easy to understand format. The average and overall values are presented in graphical view while data pertaining to each individual monitor is given in table format.
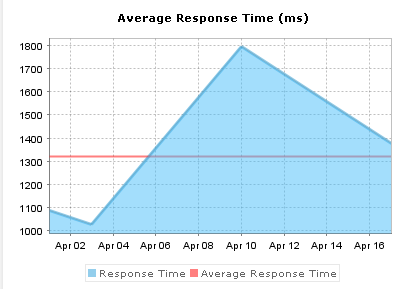
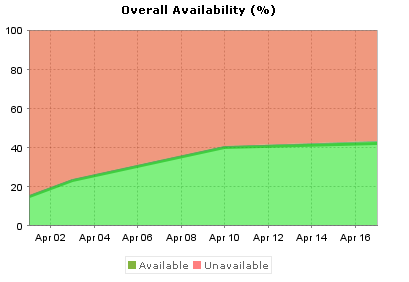
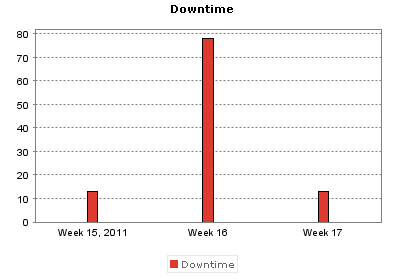
- The Average Response Time (in milliseconds), the Overall Availability (in percentage) and the number of Downtimes are shown in three separate graphs.
- Average Response Time graph
Site24x7 maps this graph by monitoring the response time of the website in question and then plots the actual response time and the average response time (red line). You can also view actual value of the response time by pointing your mouse pointer over each peak and valley on the plotted graph.
- Overall Availability Graph
Site24x7 maps this graph by monitoring the availability of the configured website and then plots the actual availability and the overall availability percentage (red line). You can also view actual availability by pointing your mouse pointer over each peak and valley on the plotted graph.
- Downtime Graph
Downtime graph is mapped by capturing the number of down times and showing it against the selected time period.If the selected time period is within 24 hours, hour wise data will be plotted against X-axis. If the selected time range is outside 24 hours period, day wise data will be depicted against the X-axis.
- Detailed information regarding the Availability(percentage), the Response Time(milliseconds), the Downtime Duration(milliseconds), Down times (number) and the SLA Achieved (if configured initially)corresponding to each individual monitor can be viewed in table format that is displayed after the graphs.
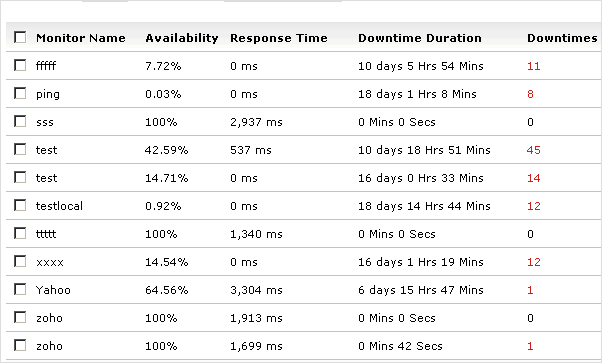
- By clicking the individual values under Availability(%), Response Time(ms) and Downtime Duration(ms), you can view respective reports against the chosen monitors. These reports will open in separate windows and is explained in detail below.
- Availability Report
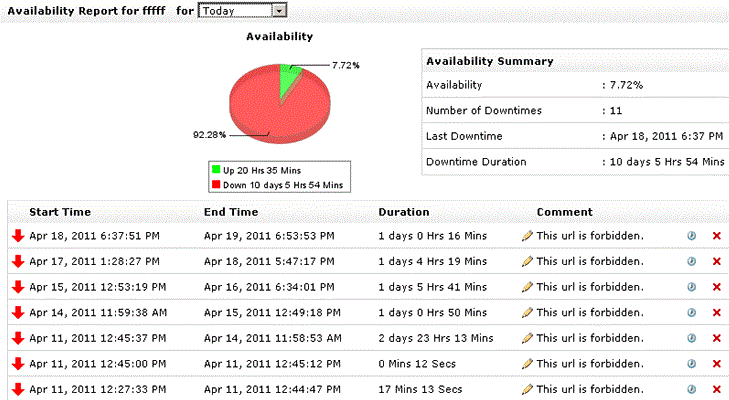
Availability Report for a particular monitor can be generated by clicking on the availability percentage value under Availability. You can also generate 7/30 availability reports for the particular monitor by selecting from the drop down list. The report would include Start time, End time, Duration and a comment on why the downtime occurred will also be registered. You also have the ability to remove or mark the downtime as Maintenance.
- Response Time Report for a particular monitor can be generated by clicking the individual value under the tab Response Time. Response Time Report will open in separate window. This report will include hour wise/day wise response times (depending on the chosen time range) and average response time by each location. Response time report can be generated for the required time period using the From and To fields.
Compare Reports
Compare option provided in Summary Report helps you to have a more detailed performance analysis of your configured monitors. This feature compares the response time of two or more of your configured monitors and a graph is mapped by plotting the time period against each monitor's response time values.
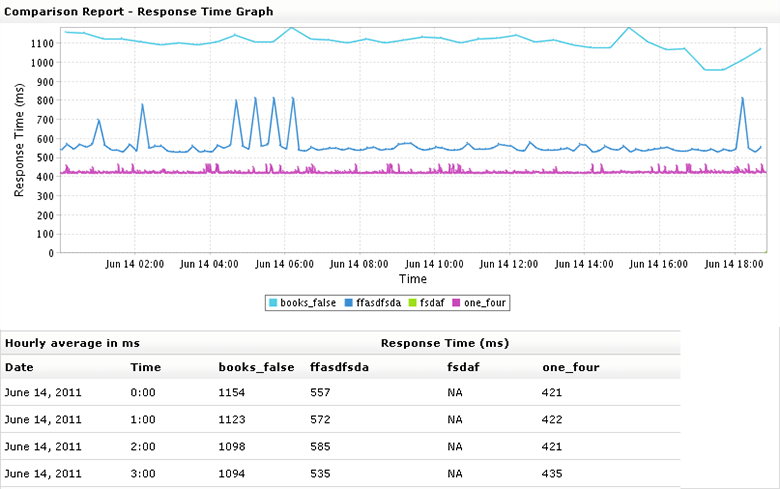
Comparison Report can be generated by selecting the required monitors from Summary Report and clicking the Compare button. Comparison Report-Response Time Graph will be displayed in a separate window.