Azure SQL Database Monitoring
Continuously monitor critical database metrics and identify disruptive events that result in poor performance.
계획, 가격 및 가입30-Day Free Trial, sign up in 30 seconds  Database performance tuning
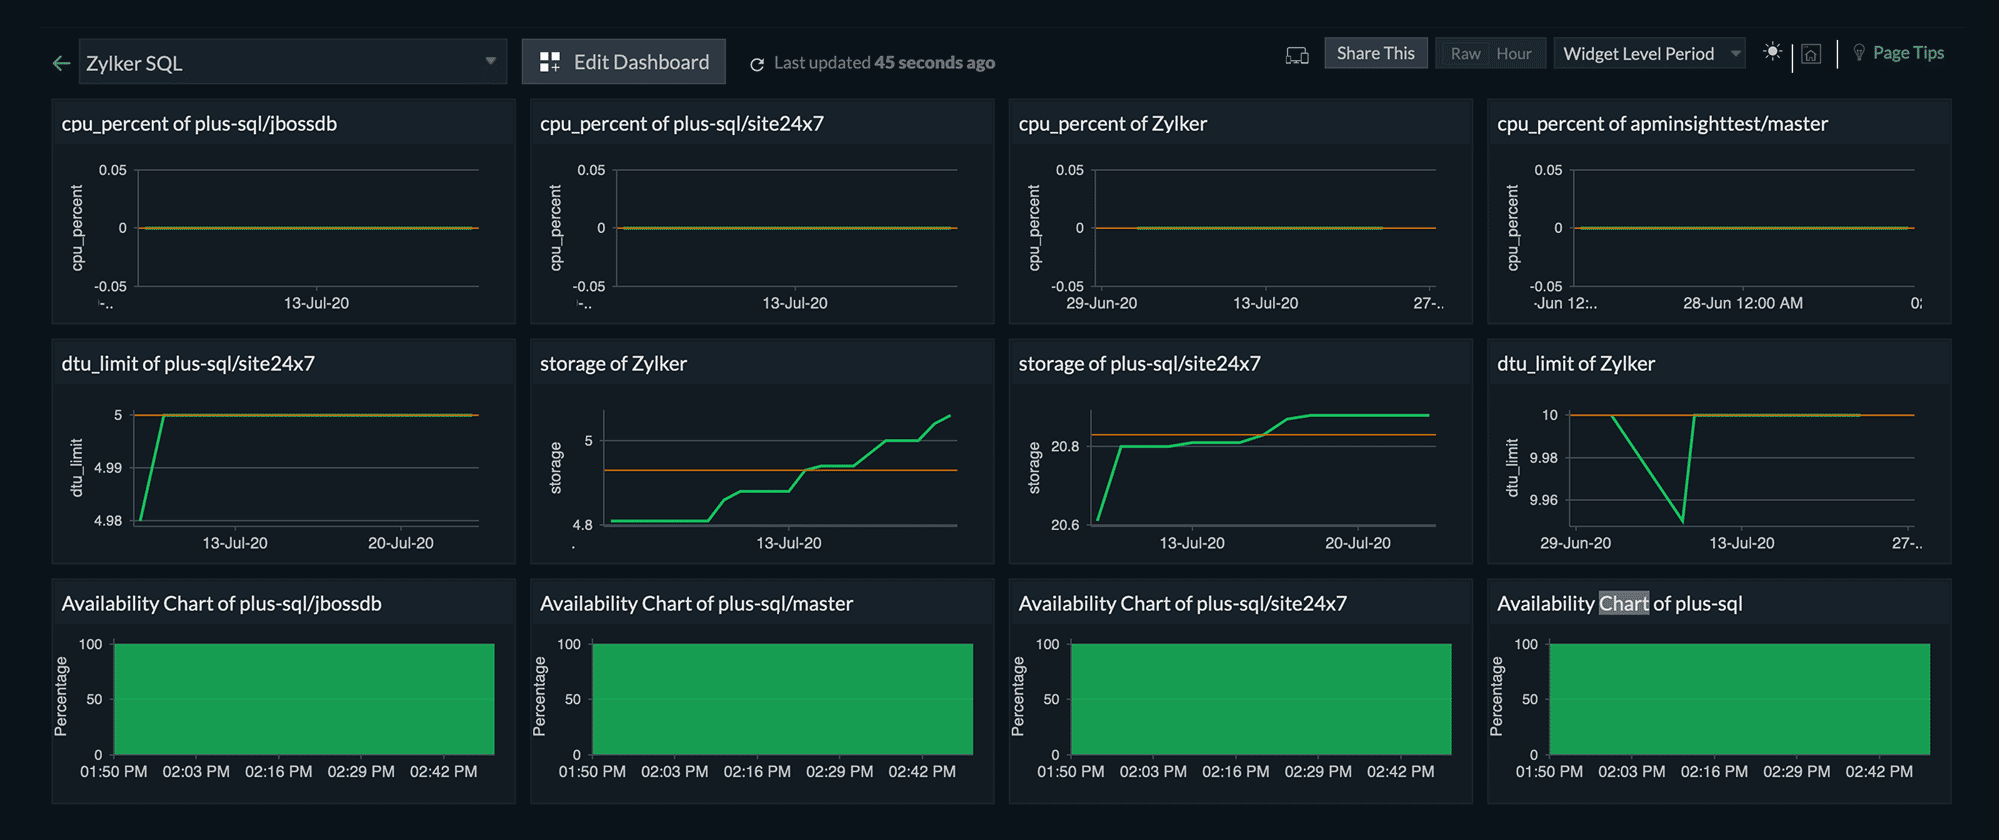
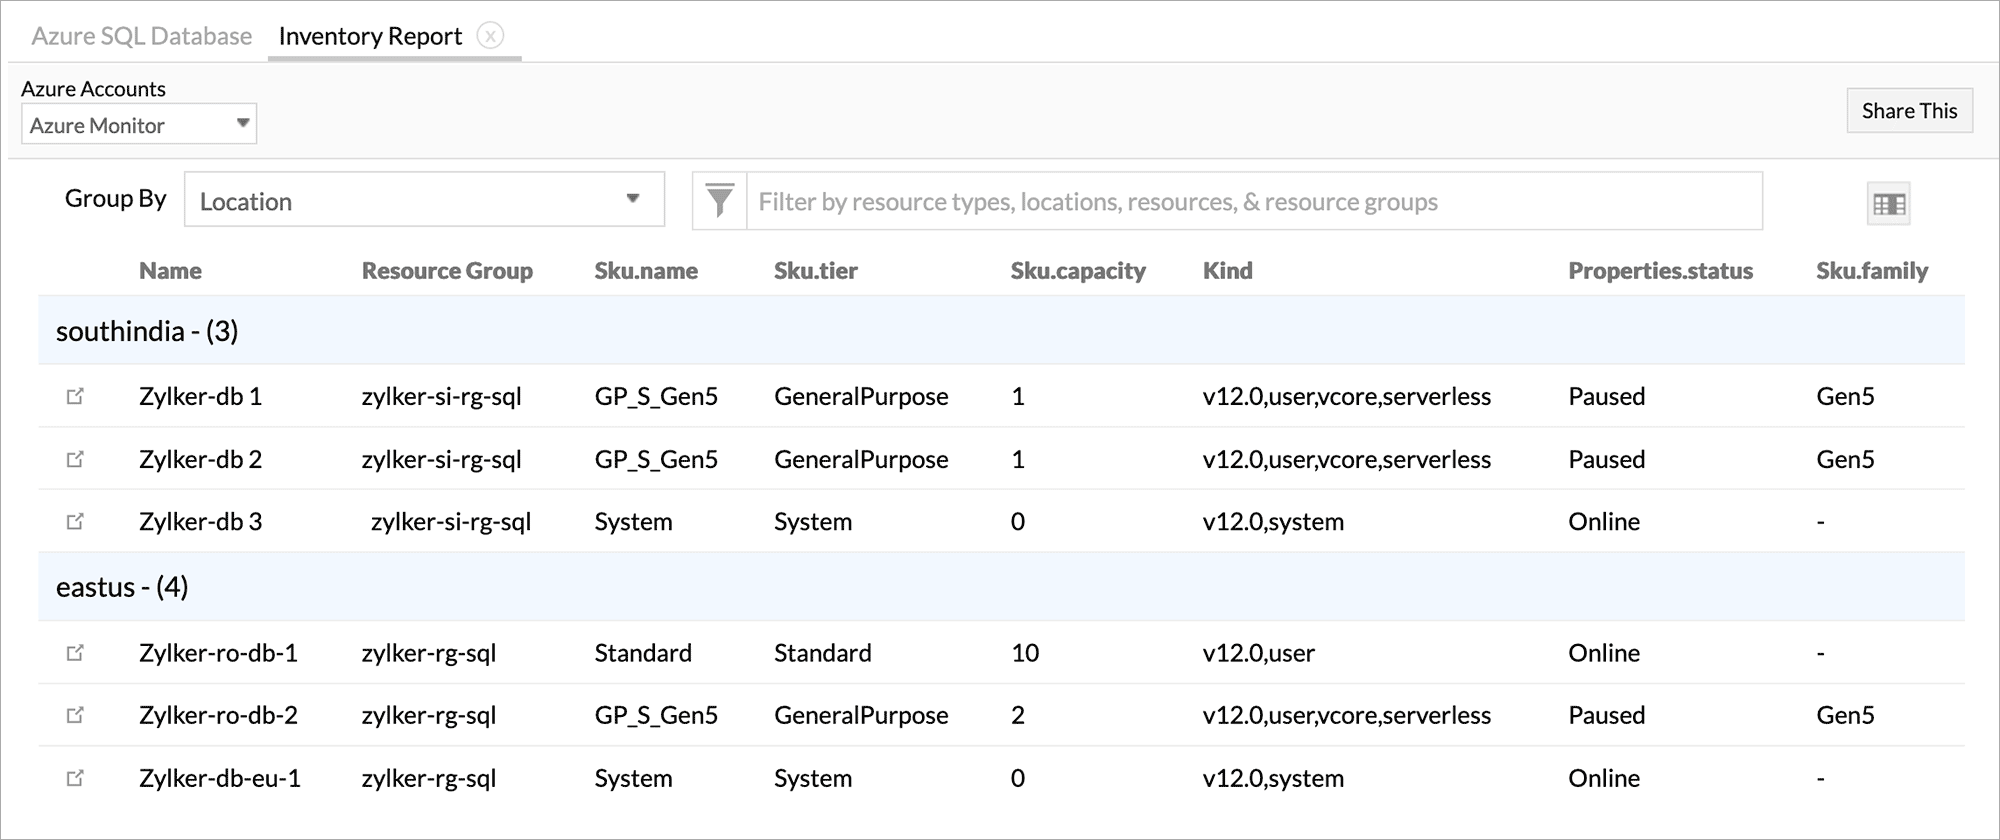
Gain visibility into your Azure SQL cloud environment and access Azure SQL database query statistics from a single view for better correlation and identification of performance issues. Track key performance indicators, like the top queries by CPU, I/O, CLR, slow running queries, and frequently executed queries, and notify users of events and outages that occur in their systems. Auto-resolve performance and availability issues with IT Automation.
 Resource utilization planning
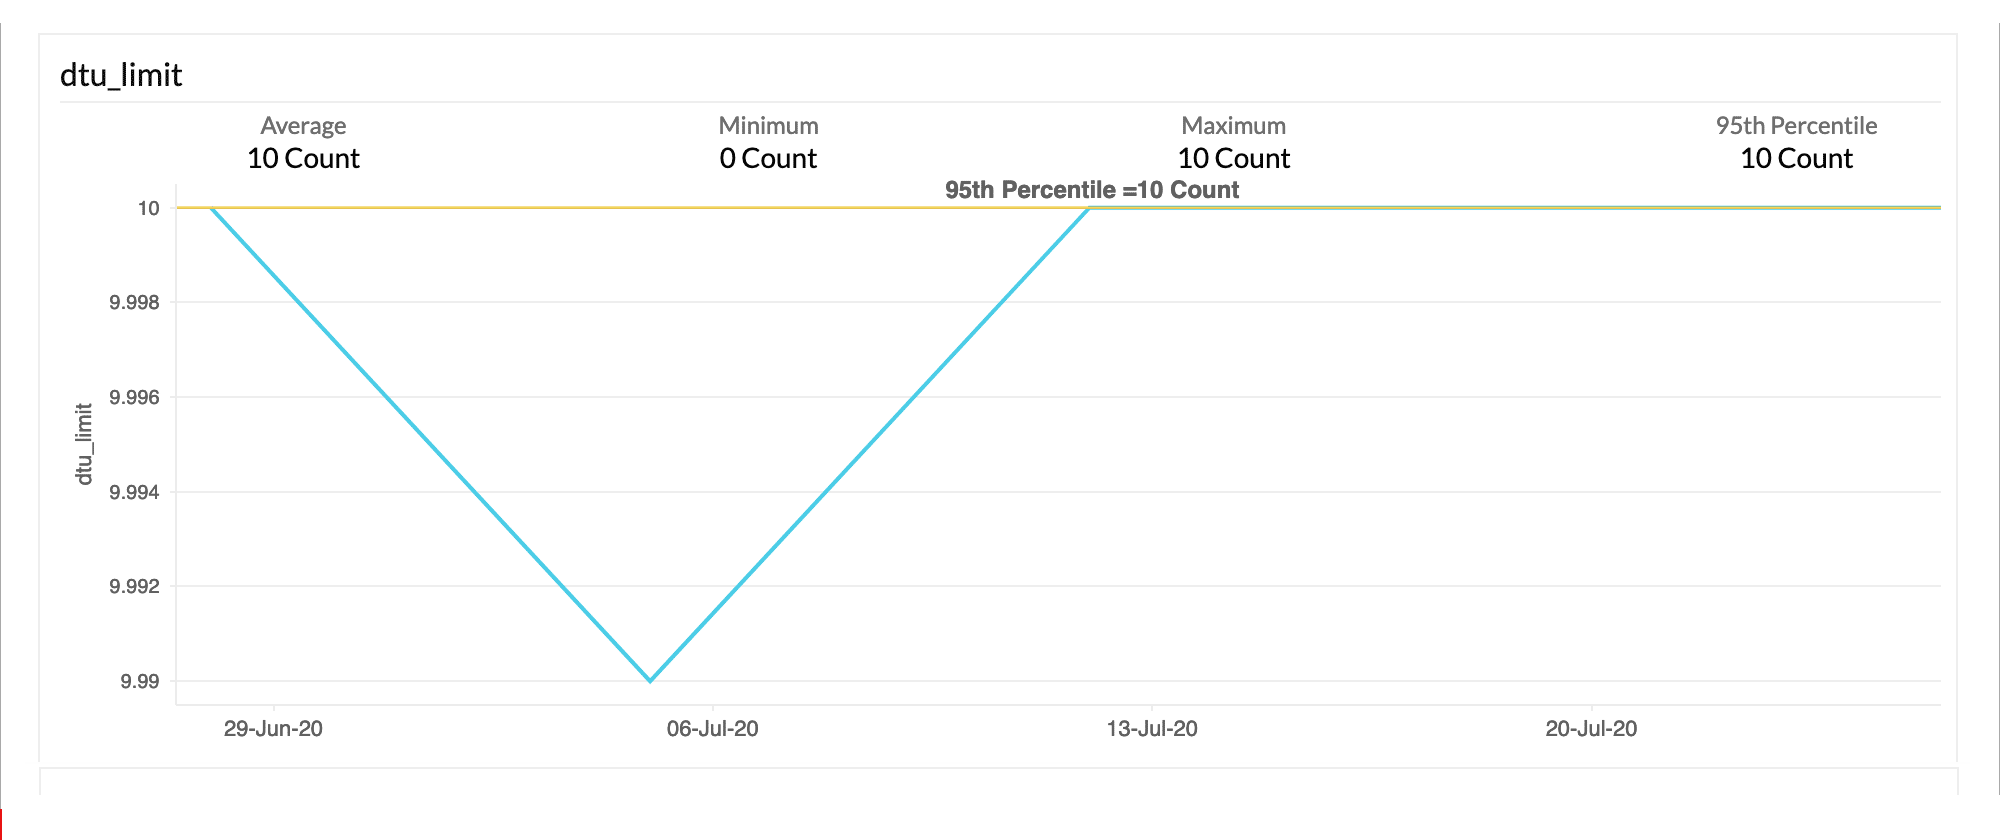
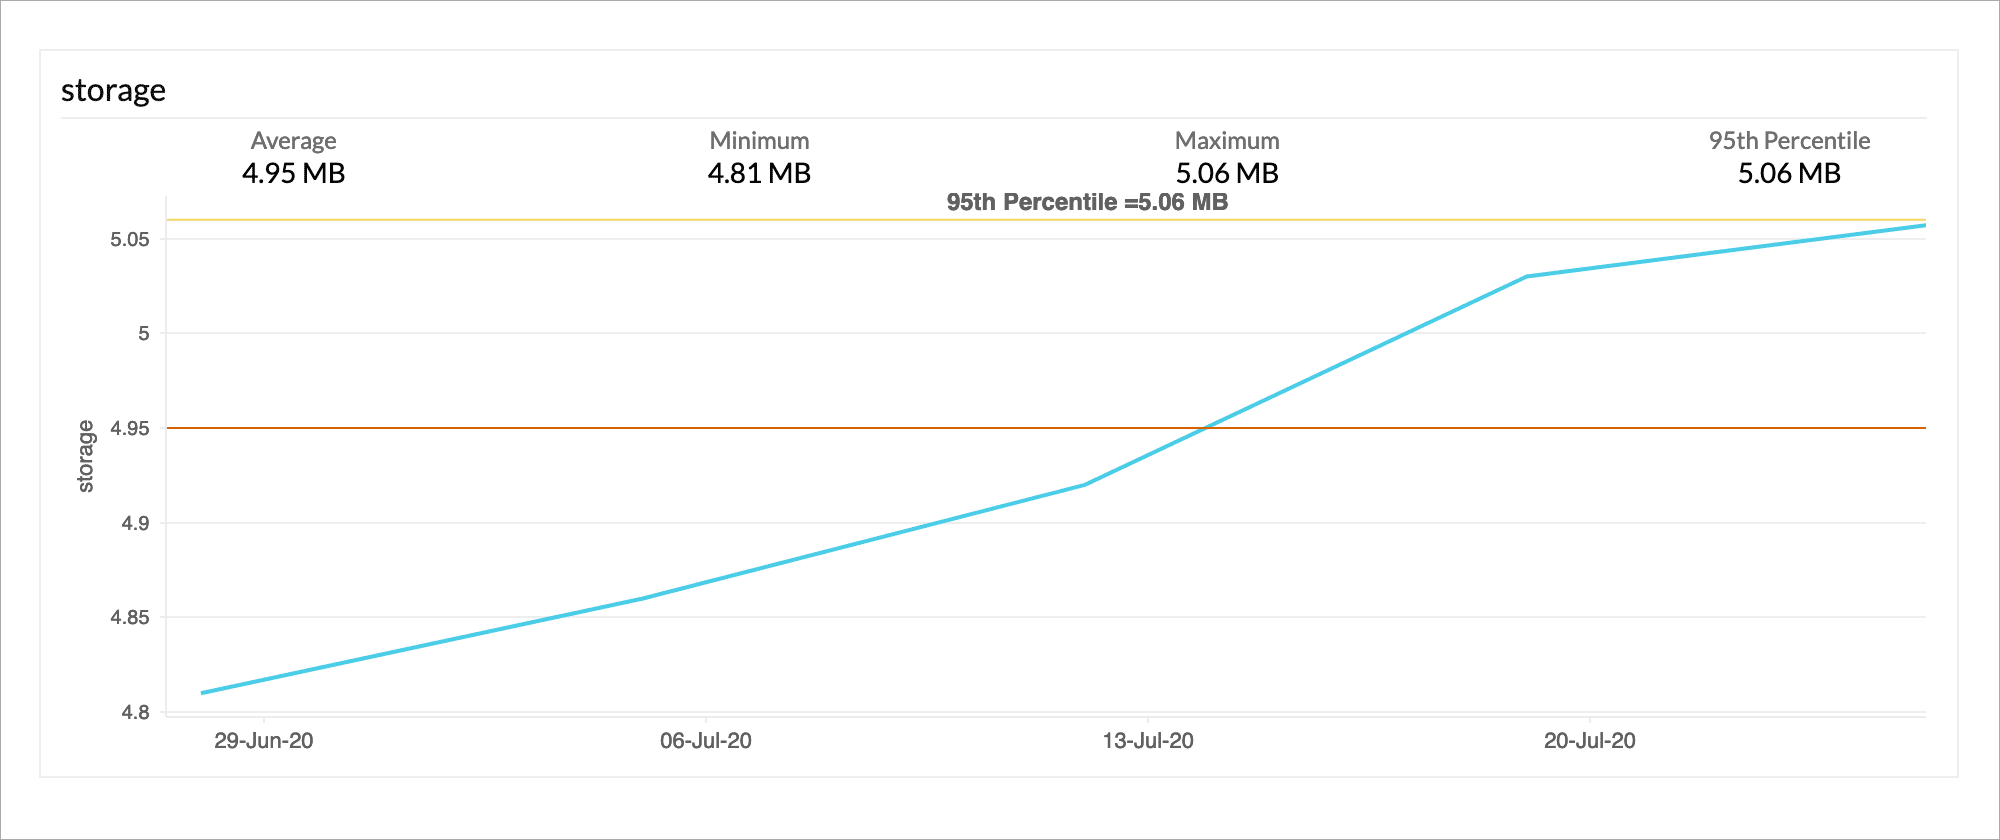
Identify if your database has excess capacity or has maxed out its resources by gaining insights into key performance indicators like DTU usage (measured as a combination of CPU, I/O, and memory usage in your database) and R/W utilization. Stay alerted before the maximum capacity is reached, and ensure general performance efficiency by getting visibility into resource consumption.
 Active sessions and connections
Get deep insights into each resource's metrics, like CPU, reads, writes, and the number of sessions and client connections, and analyze if the workload matches the performance. Visualize performance graphs and see query performance trends and activity details.
 Blocking queries and deadlocks
Get details on wait times during query execution, long running and block queries, and deadlock count, and troubleshoot issues quickly. Stay alerted when a deadlock occurs and pinpoint failed processes.
Full-stack monitoring
Auto-discovery
End-to-end visibility
Easy setup
Alerts and Reports
Monitor all your Azure services with our AI-powered monitoring tool.

Function Apps

Azure Service Bus

ADM Health Check

Windows Virtual Desktop

Virtual Networks

Network Interfaces

Disks
100+ Out-of-the-box Plugin Integrations
Redis
MySQL
NGINX
Nagios
Apache Zookeeper
Elasticsearch
Apache Kafka
HAProxy
ActiveMQ
Apache Tomcat
 Database performance tuning
 Resource utilization planning
 Active sessions and connections
 Blocking queries and deadlocks


