Get actionable insights on Azure Web App performance.
Automatically discover newly added web apps and mark them for monitoring by keeping track of all the critical performance metrics, like total request count, error codes, and response time, to ensure each web app is performing optimally.
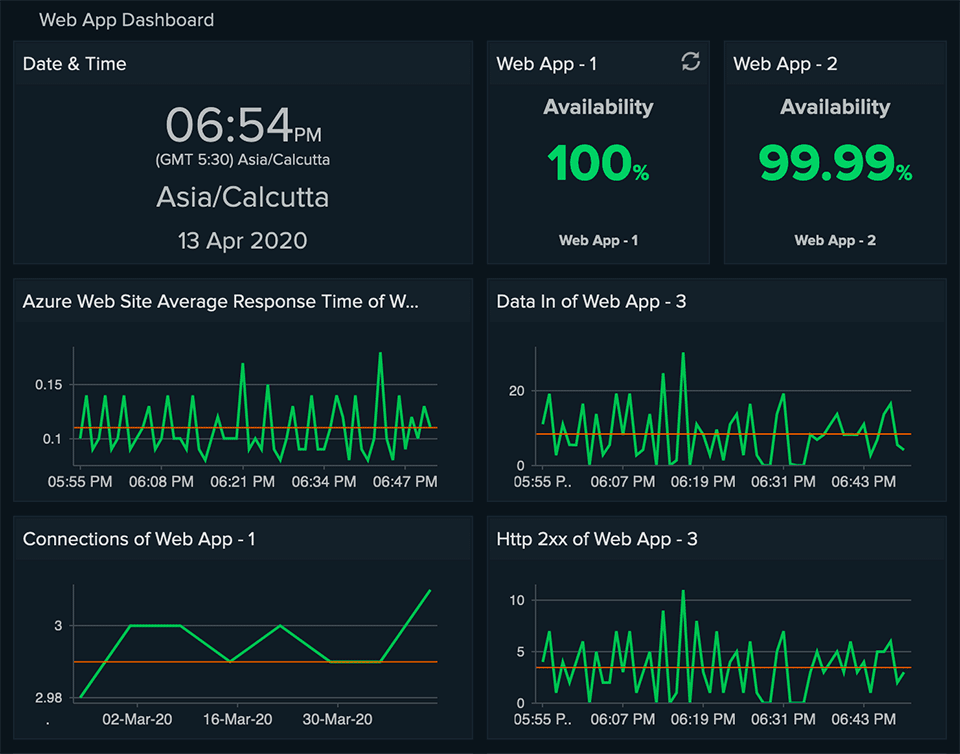
Gain access to a detailed performance report with an intuitive graphical representation of each metric; analyze performance counters split by time duration; and measure the average, maximum, and minimum values for each metric.


All the infrastructure details in a single view.
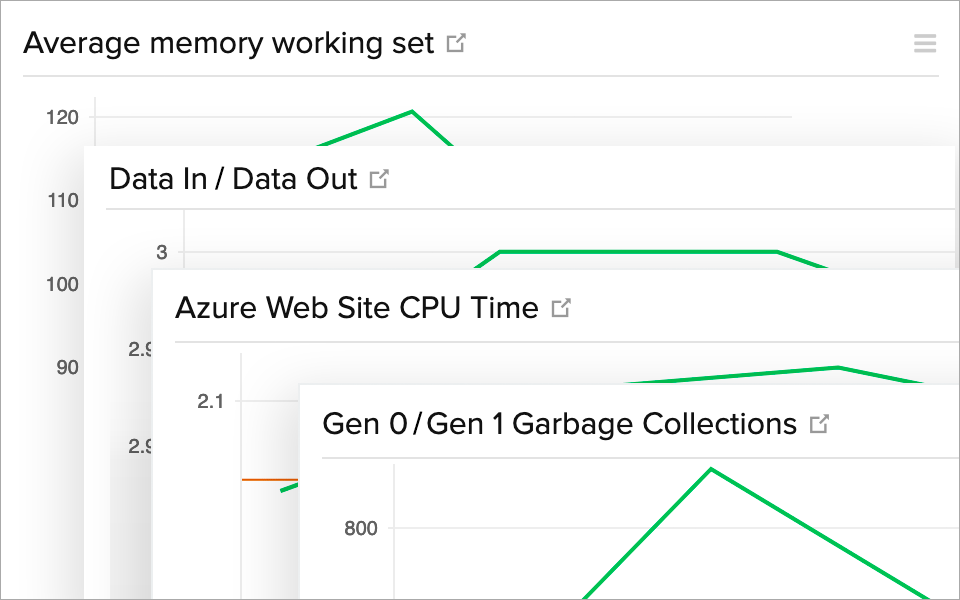
Ensure mission-critical web applications function smoothly by tracking all the critical infrastructure performance metrics like average memory, data in/out details, and IO read/write bytes.
Gets a birds-eye view of all the performance metrics across different web apps under a unified real-time dashboard, correlate metrics across different web apps and have complete visibility over the entire infrastructure in a single view.
Stay on top of the status of each web application in the Events Timeline widget, and set automatic notifications based on threshold violations.
Full-stack monitoring
Auto-discovery
End-to-end visibility
Easy setup
Alerts and Reports
Monitor all your Azure services with our AI-powered monitoring tool.

Function Apps

Azure Service Bus

ADM Health Check

Windows Virtual Desktop

Virtual Networks

Network Interfaces

Disks
100+ Out-of-the-box Plugin Integrations
Redis
MySQL
NGINX
Nagios
Apache Zookeeper
Elasticsearch
Apache Kafka
HAProxy
ActiveMQ
Apache Tomcat


