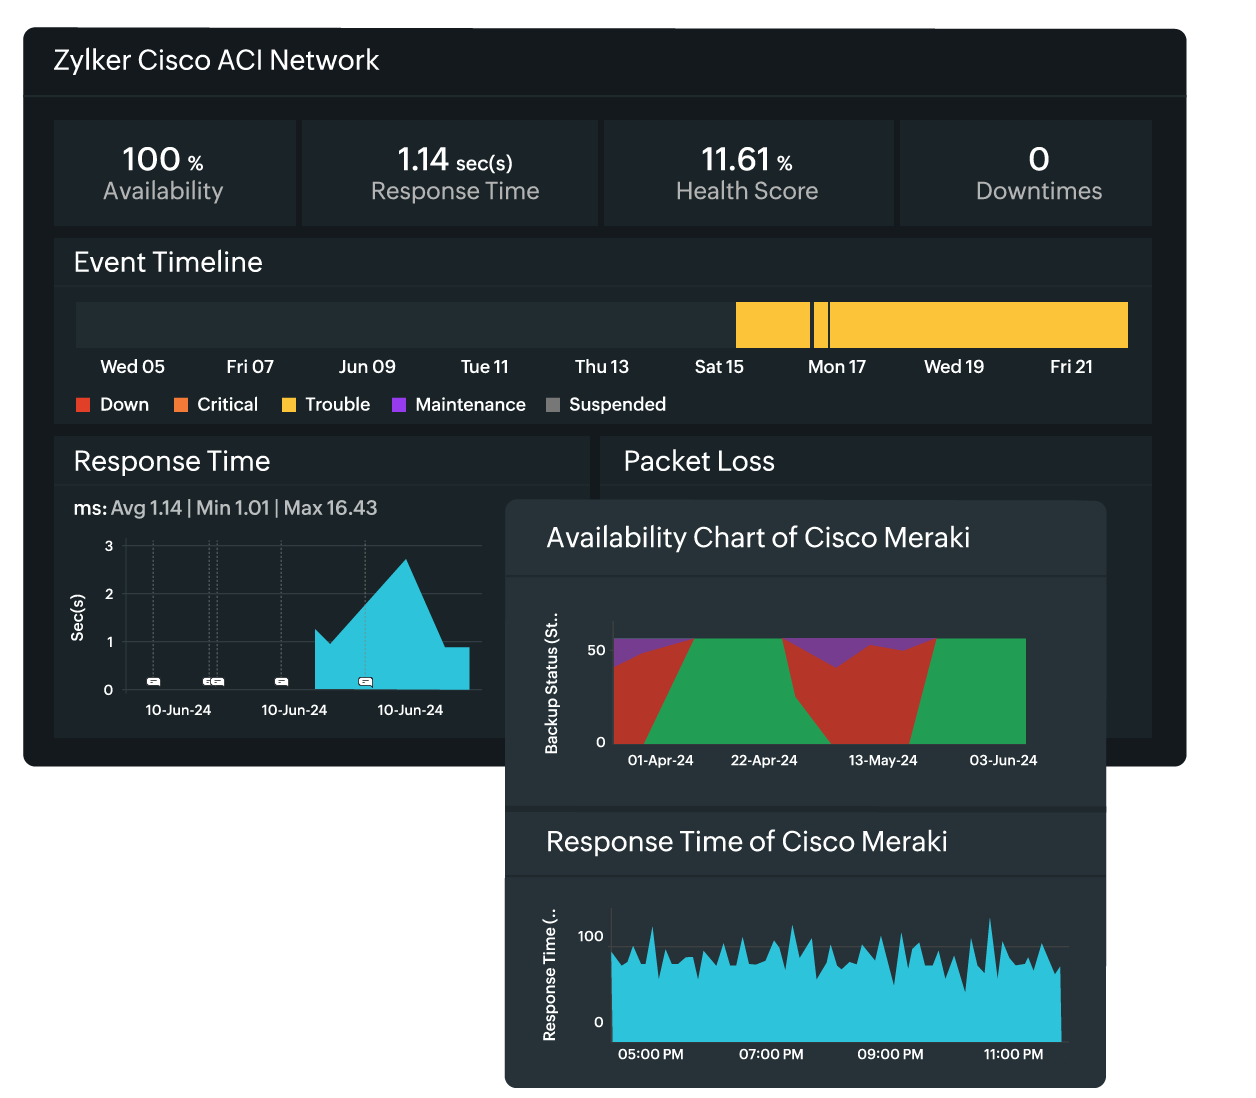
Key features of our SD-WAN monitoring tool
Oversee your networks as you wish
Choose your preferred method—SNMP, Cisco IPSLA, or APIs—to enhance visibility, optimize performance, and improve operational efficiency.
One tool to monitor multiple networks
Manage multiple networks in one place to track availability and performance while also identifying and resolving issues quickly.
On-time outage notification
Receive timely notification of network outages for quickly resolving issues, minimizing disruptions, and maintaining service availability.
On-the-go monitoring with mobile apps
Conveniently track and manage network performance on Android and iOS apps, and receive real-time insights 24/7.
How to monitor an SD-WAN
Compared to vendor-provided tools that require a separate application for each network, monitoring tools like Site24x7 let you monitor all your SDNs, SD-WANs, and on-premises networks in one place. Such tools can provide you complete observability across your organizations, minimizing downtime and reducing costs by eliminating tool sprawl.

What metrics can be tracked in Site24x7's SD-WAN monitoring tool?
Monitor any custom metric from MIB files through custom SNMP monitoring or use Cisco IPSLA to monitor the round-trip time and latency. If you are monitoring your SD-WANs through APIs, here's a list of all the metrics that are displayed in our tool.
| SD-WAN | Supported device types | Performance metrics | Configuration metrics |
|---|---|---|---|
| Cisco Meraki | Cloud-Managed Wi-Fi Access Point Cloud-Managed Network Switches Mobile Device Management (MDM) Cloud-Managed Wireless WAN (Cellular Gateway) Cloud-Managed Security Appliance (Firewall) and SD-WAN Cloud-Managed Secure Teleworker Gateway Cloud-Managed Security Cameras Cloud Managed Environmental Sensors Wireless Access Points Series Security Appliances Series (Firewall) Switches |
Device availability Response time Packet loss |
Firmware version GPS coordinates |
| VMware VeloCloud | Edge |
Availability status CPU utilization Memory utilization Tunnel count Handoff queue drops |
|
| Link |
Link status VPN state Backup state Bytes: Received, sent, and total Packets: Received, sent, and total Bandwidth, jitter, latency, packet loss, average throughput |
||
| Cisco ACI | ACI system | Health score | |
| Fabric | Health score | ||
| Super Spine/Spine | Health score | IP address Serial number |
|
| Leaf | Health score | IP address Serial number |
|
| Tenant | Health score | Bridge domain VRF Endpoint groups Application profile |
Why use Site24x7?
Multi-cloud and hybrid environment support
Monitor what you need. No worries if you’re using multiple SD-WANs or a mix of on-premises and cloud-based networks—Site24x7 can monitor it all.
Robust reporting and analyticsy
Leverage customizable dashboards and generate detailed reports that help you view the most relevant metrics, analyze trends, and track anomalies.
Comprehensive integration capabilities
Move towards a cohesive monitoring strategy by integrating with various third-party tools and services like ServiceNow, Jira, and more.
Cost-effective solution
Take advantage of flexible pricing options for businesses of various sizes while also enjoying robust monitoring across your infrastructure, cloud services, and more.
User-centric support
Enjoy round-the-clock support through multiple channels, comprehensive documentation, an active user community, and regular training and webinars to keep you updated on the latest features.
FAQs about SD-WAN monitoring
1. What is SD-WAN?
SD-WAN is a networking concept that uses software to control and manage network connections. In most cases, there is a centralized controller that helps to manage WAN connections. Examples include Cisco Meraki and VMware VeloCloud.
2. What is SD-WAN monitoring?
Monitoring SD-WANs involves observing and analyzing the availability, performance, and security-related aspects of SD-WANs. In general, data is collected from various components within the architecture, then it is collated and displayed conveniently on a dashboard, helping network administrators identify potential issues and optimize performance.
3. What is a SD-WAN network monitor?
SD-WAN networks consist of various components, including controllers, edge devices, and links, each of which can be monitored for performance and reliability. In Site24x7, these components are collectively referred to as SD-WAN network monitors. By adding these components as monitors, organizations can gain valuable insights into the health and efficiency of their infrastructure, ensuring optimal performance and swift troubleshooting when issues arise.
4. Why is SD-WAN monitoring important?
It helps optimize performance by tracking metrics and identifying issues before they impact the users, providing real-time visibility into the network traffic and increasing the overall reliability of the network.
5. How does SD-WAN work?
An SD-WAN architecture separates the network control and forwarding functions, allowing the network control function to be programmable and the underlying infrastructure to be abstracted from applications and network services.
6. What are the beneficial things SD-WAN monitoring tools can do?
- Monitor multiple distributed networks in one dashboard
- Collate metrics through several methods like SNMP, IPSLA, or APIs
- Generate WAN reports as and when needed
- Perform centralized management
- Receive proactive alerts
- Scale easily
- Visualize your SNMP-enabled devices on maps
Resources
One solution for all your network monitoring needs
Keep an eye on your software-defined networks and on-premises networks in a single tool.

