Complex applications rely on distributed services across diverse environments, and ensuring reliable performance in such systems requires more than traditional monitoring; it demands comprehensive observability. By unifying metrics, events, logs, and traces (MELT), observability provides a unified view of application health, allowing for proactive monitoring and diagnosis across the infrastructure and code layers.
For the latest industry trends, benchmarks, and expert insights, have a look at our 2025 State of Observability report. This report synthesizes findings from global organizations and highlights emerging challenges and solutions shaping the landscape of modern application monitoring.
Understanding the business process view
The business process view involves assessing applications through the lens of their contribution to business processes. It emphasizes the importance of understanding how application performance directly impacts critical business results.
The importance of aligning application performance with business goals
By aligning monitoring solutions with business processes and setting relevant SLAs and SLOs, organizations can ensure that performance metrics reflect essential business objectives. This helps teams prioritize performance improvements that enhance user experiences and drive business growth.
A case study: Application observability in action with Site24x7
Let's imagine an application named Zylker, which has both web and mobile versions. The application is comprised of a customer-facing front end, back-end APIs for processing orders, microservices for payments and logistics, and database servers.
Business goals and key functions
- Increase customer acquisition and retention through seamless user experiences across web and mobile platforms.
- Enhance system performance for operational efficiency and scalability during peak times.
- Ensure that the application consistently meets SLAs and SLOs to maintain customer trust.
- Leverage analytics for business insights to optimize marketing and sales.
Observability tools like Site24x7 provide the Zylker team with metrics to track user interactions, order processing, and delivery times, enabling proactive issue resolution, performance optimization, and seamless user experiences.
Application performance monitoring: The core of observability
Application performance monitoring (APM) is the cornerstone of application observability. Site24x7's APM tool captures detailed metrics concerning application performance, enabling proactive monitoring and troubleshooting. With multi-platform support, it seamlessly monitors applications across diverse environments, including Java, .NET, PHP, Node.js, Ruby, and mobile platforms, ensuring comprehensive performance insights.
Enhancing user experiences and business reliability with transaction monitoring
Monitoring Zylker's key transactions, like user logins, order placements, and payment processing, is crucial for both user satisfaction and business reliability. Delays in these processes, such as slow payments or delivery updates, can lead to customer frustration and lost orders. With transaction monitoring, the Zylker team can gain insights into response times, throughput, and error rates to identify and resolve performance bottlenecks effectively, enhancing user experiences and the brand's reputation.

Boosting application efficiency and reducing latency with code-level monitoring
Zylker's team needs to identify performance bottlenecks, which lead to slow response times, high latency, and an overall poor user experience. Code-level monitoring can help the team identify precisely where delays occur, whether from slow database queries, poorly optimized methods, or external dependencies like third-party payment gateways. By drilling down into the code, the Zylker team can quickly identify and resolve performance issues to boost application efficiency and reduce latency for smoother user experiences.

Ensuring application stability with error tracking and exception analysis
When the Zylker application experiences sudden spikes in errors, especially during peak hours, it becomes challenging for the team to identify and resolve the underlying issues quickly. The error tracking and exception analysis features of Site24x7's APM tool provide real-time visibility into issues as they occur. Detailed stack traces and contextual information enable the Zylker team to pinpoint root causes quickly and efficiently.

Maximizing business insights with the MELT framework for complete observability
The MELT framework provides the required data sources for maintaining a robust observability strategy.
Metrics: Measure resource efficiency and application health
- Challenge: Resource inefficiency and undetected application issues during periods of high traffic
- Solution: Monitor system metrics (like CPU, memory, and disk usage) to identify resource bottlenecks, application metrics (like response times and error rates) for transaction insights, and database metrics (like query execution times) to resolve slow queries impacting order placements.
Events: Track changes and incident resolution
- Challenge: A lack of visibility into application changes and incident handling
- Solution: Track application events (like deployments and scaling) and incident events (like downtime and failed health checks). For instance, immediate alerts for payment service failures will enable faster resolution.
Logs: Gain insightful diagnostics and historical context
- Challenge: Diagnosing performance issues without actionable insights
- Solution: Analyze logs from servers, applications, and custom events. Correlate spikes in response times with logs to trace root causes, such as a failed deployment or infrastructure misconfiguration.
Traces: Ensure seamless microservices communication
- Challenge: Identifying delays in a microservices architecture
- Solution: Distributed tracing maps the request flow across order, payment, and delivery services. End-to-end request tracing ensures that delays, like a timeout in the payment gateway, are quickly identified and resolved.

Businesses often face challenges when monitoring distributed systems due to varied data formats and tools. OpenTelemetry standardizes metrics, traces, and logs, enabling consistent data collection across microservices. For e-commerce platforms, this ensures real-time tracking of user interactions and back-end dependencies while identifying performance issues. With OpenTelemetry support, businesses can seamlessly integrate existing telemetry data, ensuring simplified application observability.
Proactive alerting and incident management: Ensuring business continuity
A robust alerting and incident management strategy can help the Zylker team monitor essential metrics and act swiftly if there is any performance anomaly.
- Threshold-based alerts: By configuring alerts for application metrics (e.g., a response time above two seconds) and system metrics (e.g., memory usage above 85%), Zylker’s operations team will get notified if an alert threshold is crossed.
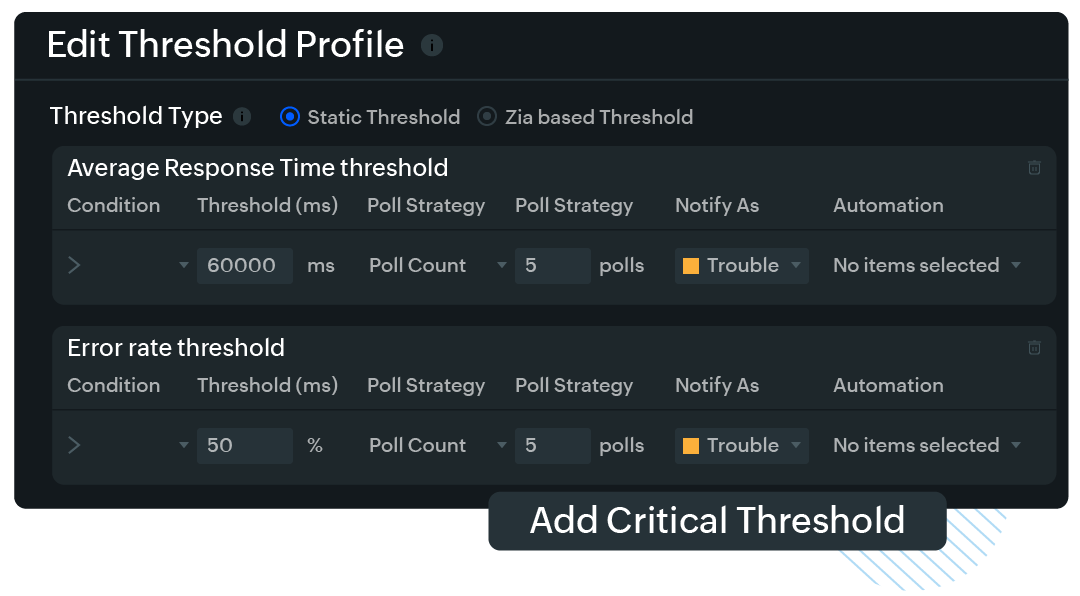
- Zia-based dynamic threshold alerts: The Zylker team can configure alerts for application metrics (e.g., response times) and system metrics (e.g., memory usage) with dynamic thresholds powered by Site24x7's Zia. These thresholds can be adjusted automatically based on historical data and real-time conditions, making alerts more accurate and less prone to false positives.
- Multichannel alerts: : Alerts can be sent via various channels, such as email, SMS, mobile apps, and integrations with incident management tools like PagerDuty or ServiceNow. This ensures that the appropriate team members are quickly notified.
- Alert escalation and incident tracking: : The Zylker team can set up escalation policies to ensure critical alerts are resolved promptly. The team can also track incidents to closure and measure the mean time to resolution.

Seamless performance with AI-driven resource forecasting and planning
Site24x7's Zia Forecast feature leverages AI to predict resource needs based on historical trends, helping IT teams anticipate CPU, memory, and storage demands. This ensures optimal application performance during peak traffic or usage spikes. By enabling proactive capacity planning, Zia Forecast helps IT teams minimize downtime, enhance reliability, and ensure seamless user experiences, allowing businesses to scale resources effectively and avoid disruptions during high-demand periods.
Boost reliability with AI-driven proactive monitoring
An AIOps platform leverages AI for anomaly detection, IT automation, and forecasting. By analyzing large volumes of data in real time, it detects anomalies and predicts potential issues before they impact performance. It also correlates events, logs, and metrics to identify patterns that may indicate underlying problems. This proactive approach enables IT teams to automate issue resolution and forecast resource needs, improving system reliability and reducing downtime.
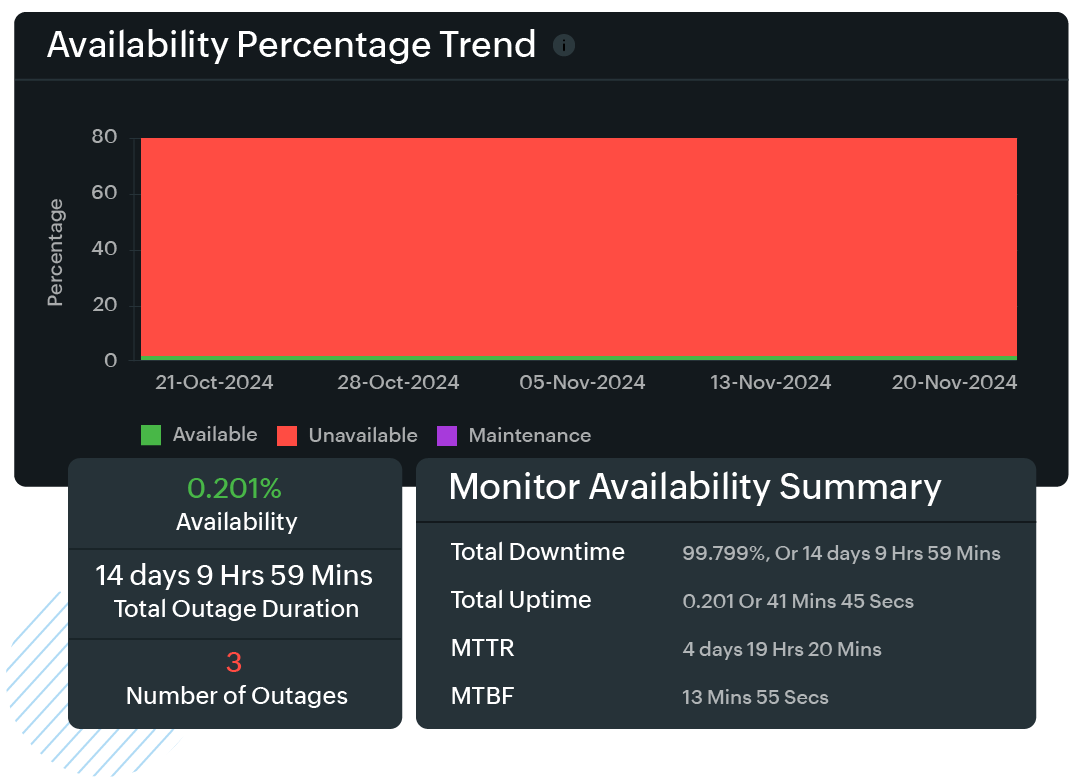
Dashboards for real-time monitoring: Enhancing visibility across operations
Dashboards provide real-time visibility into key metrics, providing a clear picture of application health.
- Customizable dashboards: IT teams can build dashboards to visualize metrics from different application components. For instance, they can create a dashboard showing real-time order placement metrics, payment processing times, and delivery tracking.
- Infrastructure maps: Infrastructure maps visualize component relationships and dependencies, helping IT teams like Zylker's identify bottlenecks, assess risks, and troubleshoot quickly for seamless e-commerce operations.
Reporting and analytics: Data-driven business decision-making
- Performance and resource utilization reports: Organizations can generate performance, availability, and resource utilization reports to gain actionable insights into their systems' health. They can also track key metrics over weekly or monthly periods to identify trends and plan improvements. Analyzing resource utilization helps them optimize server configurations and prepare for future growth. For the Zylker team, this means identifying peak demand periods and allocating compute resources accordingly, ensuring seamless operations.
- Scheduled reports: Scheduled reports allow e-commerce apps like Zylker to automate performance tracking, providing regular insights into key metrics like sales, traffic, and user behavior. This enables proactive decision-making, optimizes performance, and improves overall efficiency.

Server and cloud monitoring: Optimizing infrastructure for business efficiency
- Server metrics: The Zylker team can track metrics, like the CPU load, memory utilization, disk usage, and network traffic on servers, to identify if any server requires scaling or has issues that need fixing (e.g., high memory usage on the payment processing server).
- Cloud monitoring: Monitoring cloud infrastructures (AWS, Azure, and GCP) for instance health, resource scaling, and cost analysis is useful if Zylker is hosted by a cloud provider, ensuring optimal usage and cost-efficiency.
- Container and Kubernetes monitoring: The Zylker team can monitor Docker containers and Kubernetes clusters used by Zylker for microservices. The team can also track metrics such as pod statuses, container memory usage, and cluster node health.
The end-to-end application observability workflow
Combining the MELT framework with Site24x7’s monitoring features creates a comprehensive observability workflow for the Zylker application:
- Detect issues early with APM and alerts: The real-time monitoring features of Site24x7's APM tool detect issues (e.g., slow response times in the checkout service) and generate alerts for thresholds being crossed.
- Correlate data using MELT: Event correlation aids root cause identification by tracing the sequence of events leading to an outage. Using MELT enables faster diagnosis and resolution of issues.
- Analyze root causes and resolve them quickly: Root cause analysis is performed by drilling down into logs, distributed traces, and code-level insights, enabling prompt issue resolution.
- Prevent future incidents: Root cause analysis is performed by drilling down into logs, distributed traces, and code-level insights, enabling prompt issue resolution.
- Continuously monitor and improve: Regularly reviewing dashboards, reports, and alerts ensures ongoing optimization of the application's performance and user experiences.
Achieving complete application observability with Site24x7

By leveraging Site24x7's features, such as the APM tool, alerting, dashboards, reports, and server monitoring, the Zylker team achieves full observability, gaining comprehensive insights into all application aspects, from infrastructures to transactions. This holistic approach fosters proactive issue resolution, capacity planning, and performance optimization, resulting in a resilient, user-friendly application aligned with business objectives.
Ready to unlock the power of full application observability? Sign up for a free trial of Site24x7 and experience the difference firsthand.
Start your observability journey today
Start 30-day free trial Try now, sign up in 30 secondsWant to learn more?
- Personalized product demo
- Proof of concept for set up
- 30-day, unlimited, free trial
Interested in our services?
- 24/5 customer support
- Flexible and competitive pricing
- Better ROI