[New Feature] 5 Reasons to compare your APM Metrics
" If statistics are boring, you have got the wrong numbers." - Edward Tufte
We all secretly dread that one day in our office - where we mull over mundane data, curse the crunching numbers, figure out the graphical charts and present our reports. Though we console ourselves by saying " Let the numbers do the talking," in reality, we don't infer much from our reports.
Reports play a vital role in enhancing your application's performance over time. But how do we get valuable insights from those tricky numbers by removing their layer of obscurity? Well, the key is to compare reports in context instead of merely reading them.
By analyzing key metrics of your application's performance, one can identify potential bottlenecks and remove redundancy. Read on to discover how comparing reports using APM Insight can enhance your application's performance.
1. Prepare for your big sales day
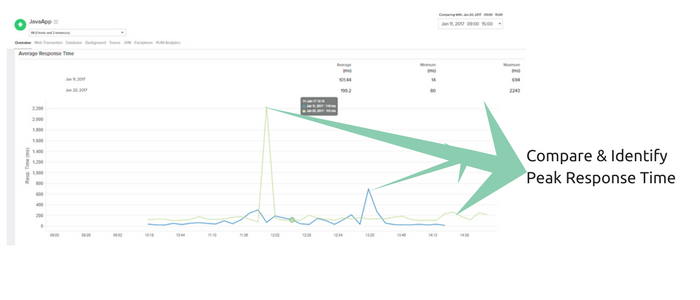
Lots of foreplanning goes in handling the influx of traffic during one-day sales. By
comparing the application performance during a normal day and peak sales day, one can trace page slowness and identify the bottlenecks during the given period. This will enable you to take appropriate measures when you prepare yourself for high traffic days like Black Friday or Cyber Monday.
2. Compare product performance during build updates
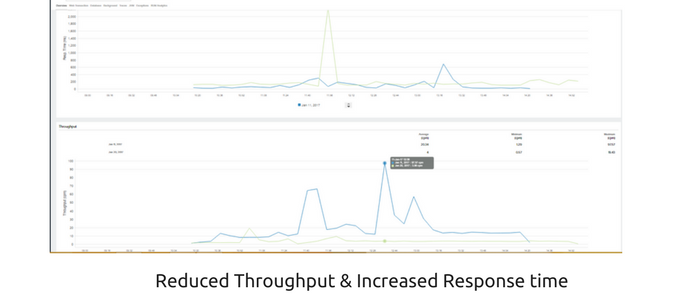
While continuous optimization can lead to product enhancement, there are pretty much good chances that it might affect product performance. For instance, a tweaked query may have your database optimized, but might have resulted in increased response time. How do you figure that out? Compare the relevant metrics before and after your build update to pinpoint the actual reason behind the difference in response time, and take appropriate action. This will help in the identification of potential bottlenecks.
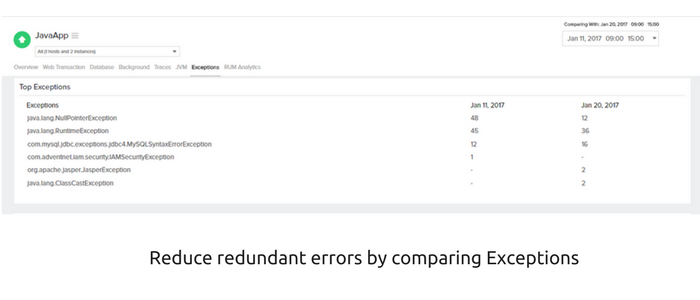
3. Reduce redundant errors
Constantly iterated websites can prove to be a headache for operations, especially when they throw a bunch of errors. Sometimes, failing to load images from static link server can increase the response time manifold. These redundant errors can be reduced by comparing the response time of web pages before and after iteration.
4. Identify root cause of a problem
There are various factors that contribute to an abandoned shopping cart. It could be
your slow landing page, unattractive images or page loading time. But what if your reports tell you otherwise? Sometimes, you need not place the blame entirely upon your application. Third party API's, payment gateway integrations and many such factors contribute to it. Head straight to compare your reports to figure it out.
5. Eliminate the blame game
Ha! We're all familiar with this scenario. The developer points the designer, the designer points the product lead and product lead points over to you. By figuring out the root cause of the issue, one can eliminate this war room scenario. Pull out your reports, compare the bugs and let the data do the rest.
So what are you waiting for? Pick out your reports and let the Einstein in you take care of the rest.
In case you're wondering how to get started, you can compare your reports with
Happy Monitoring !!