Debugging Kubernetes pod pending failures
Every pod has its purpose. During an application deployment, all the workloads in the cluster work cohesively and ensure that the deployment launches—without any hiccups.
When a pod is created, it starts its lifetime in a Pending state. A pod is in the Pending state when it is still in the process of being scheduled for deployment. When it is scheduled for deployment and the containers have started, it converts to the Running phase. It only takes a few seconds for the phase transition.
What if the pod is unable to progress from its pending state to running state?
It results in a pod pending failure.
The Kubernetes pod pending failures can occur due to different reasons. In this article, we will explore the top four reasons and how to debug the pod pending failures.
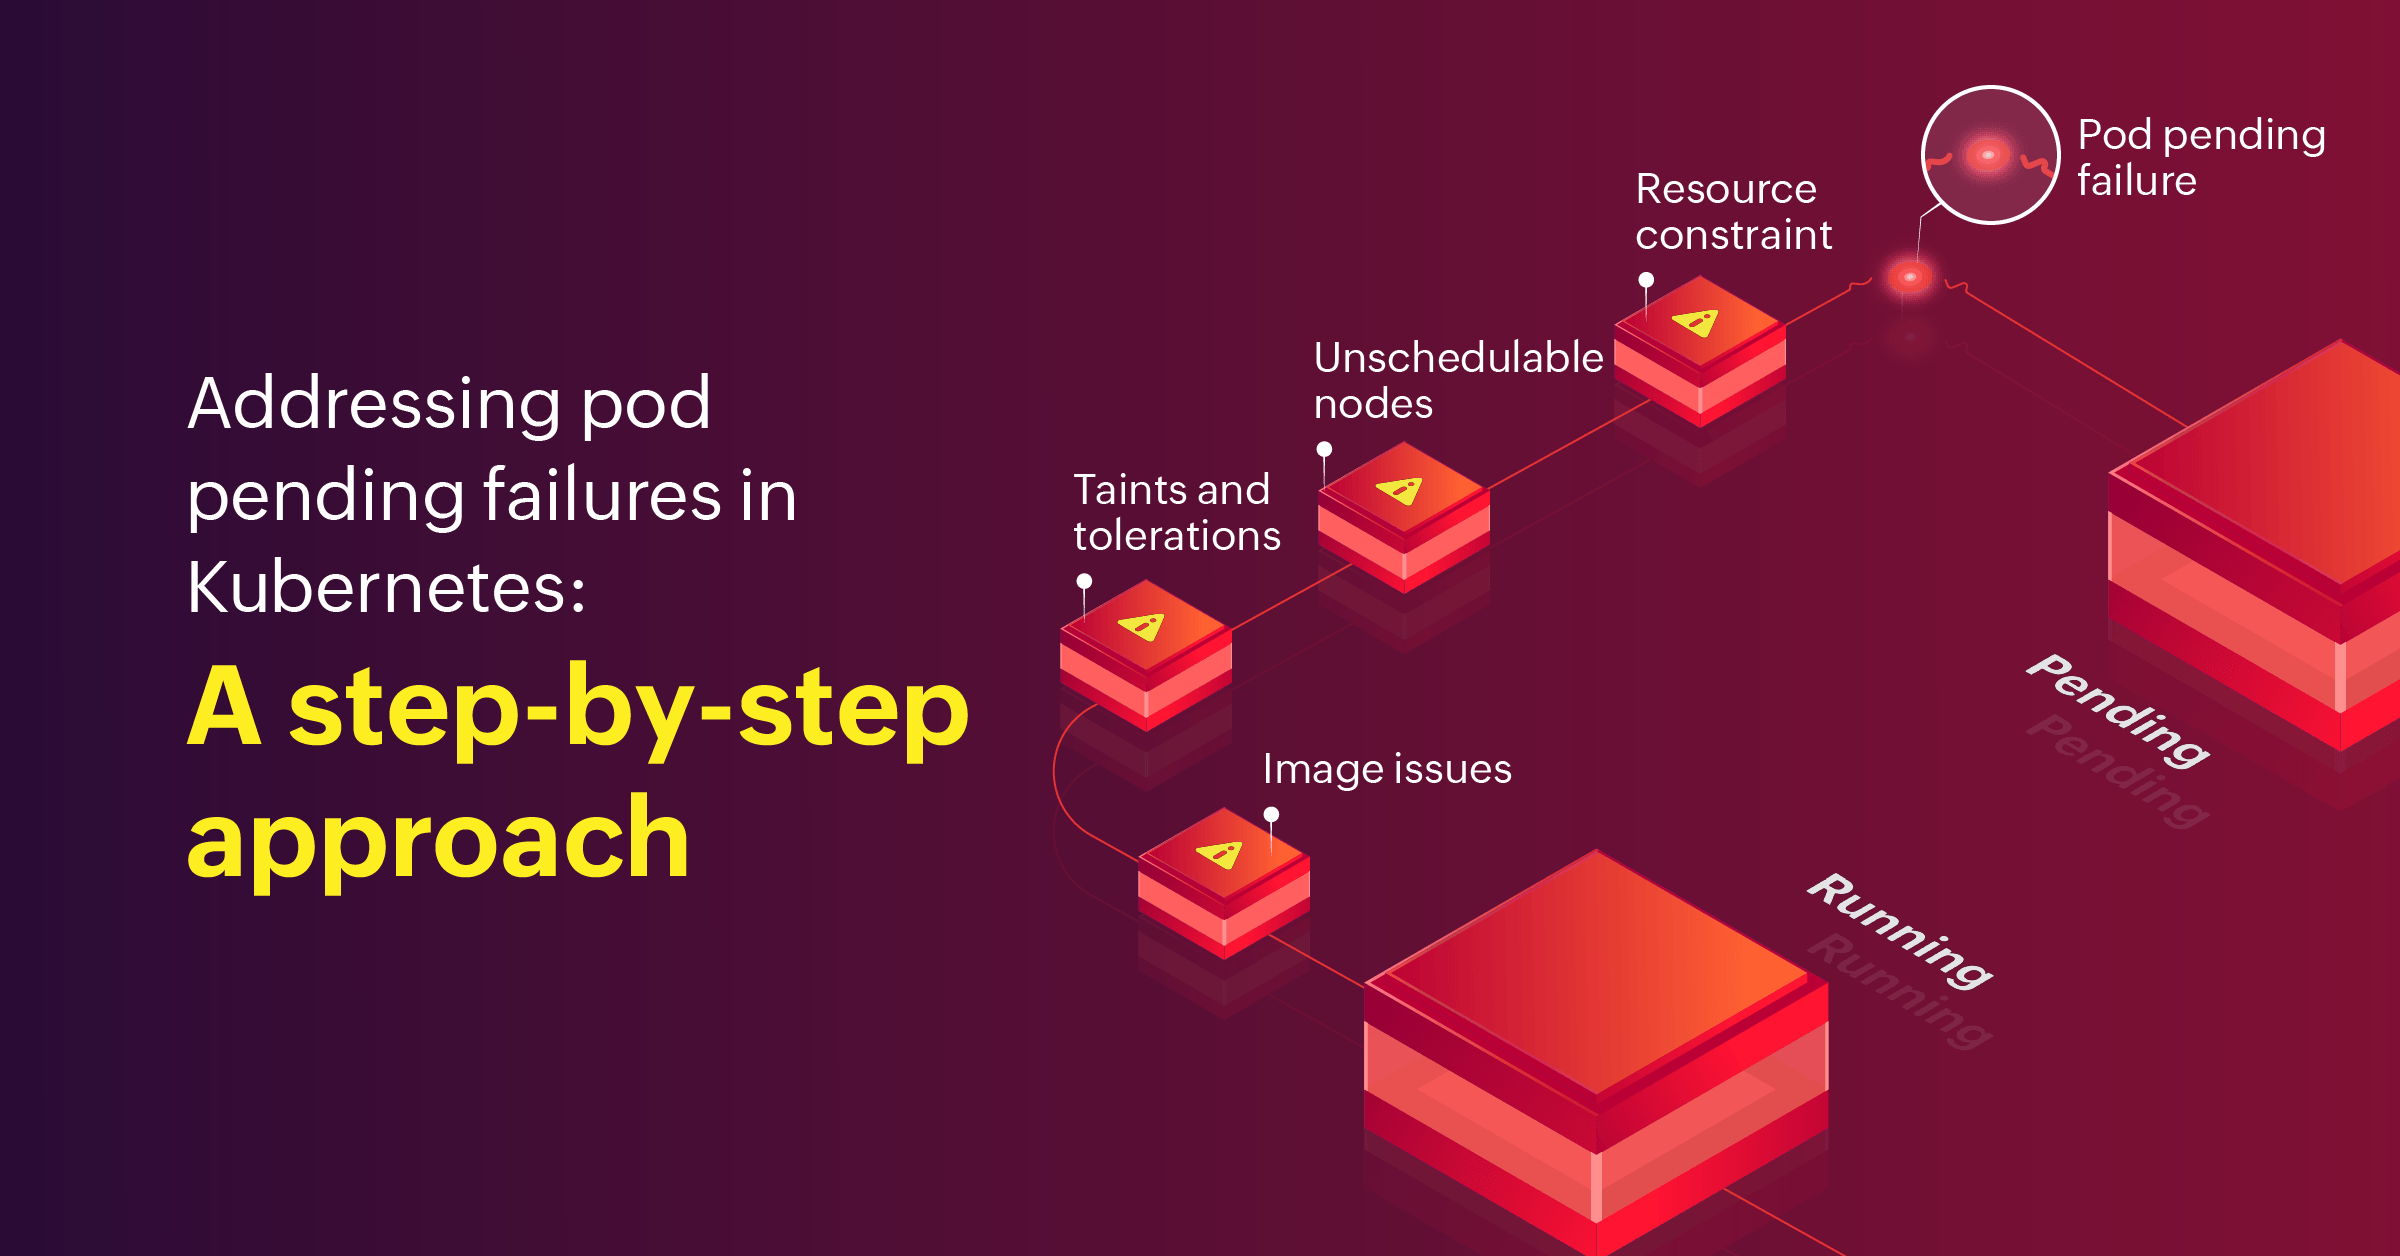
Top four reasons that cause pod pending failures:
Here are the top four reasons that can cause pod pending failures:
1. Resource constraint:
Resource constraint is one of the most common causes that leads to pod pending failures. If any node in the cluster does not have the enough requestable CPU or memory of the pod, the Kubernetes environment will not be able to schedule the pod. The pod stays in the pending state until the node becomes available to spawn it. This causes pending pod failures.
2. Unschedulable nodes:
If a node is marked as unschedulable, then pods cannot be scheduled onto that node and they will remain in the pending state. The Kubernetes Scheduler will disregard it when determining workload placement, which will be reflected in your node configuration as:
Unschedulable: true
Unschedulable: true
The reason for the unschedulable state could be due to any node-level conditions, which varies from memory or disk pressure or if someone has cordoned (kubectl cordon <NODE_NAME> ) the node intentionally.
3. Taints and tolerations:
Another reason for Kubernetes pod pending failures is when the node has taints applied to it. Taints are restrictions that are used on nodes to prevent pods from being scheduled on those nodes. The main purpose of applying taints is to designate that node for specific workloads with specific purposes. Only pods with tolerations matching the taints on the nodes can be scheduled to run on those nodes. In such cases, the pods remain in the pending state, unable to run and stuck until the toleration is configured.
4. Image issues:
After the pod has been assigned to a node, the kubelet will attempt to initiate all the containers specified in the pod. To accomplish this, it will attempt to fetch the image and execute it. Several errors may occur preventing the execution. For example, if the image name is not valid, it will lead to an ImagePullBackOff error. This can also happen if the image name provided in the pod definition is incorrect or when it does not exist in the container registry.
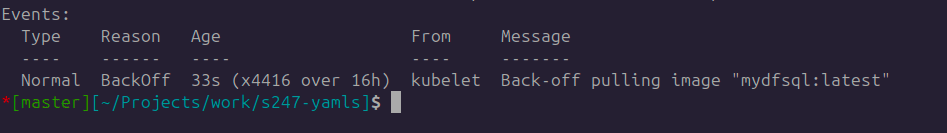
Similarly, ErrImagePull error will occur when the image specified for a container can't be retrieved or pulled.
Other mistakes include inaccurate image tags, wrong repository, or a repository that requires authentication.
These are some of the recurring issues that restrict the pods from running and accomplishing their task. These reasons will straight away lead to Kubernetes pod pending failures.
How to debug Kubernetes pod pending failures
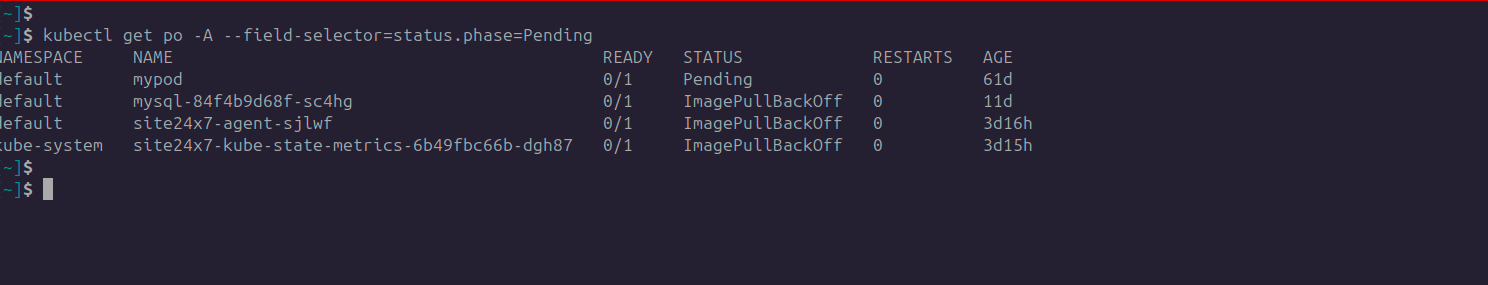
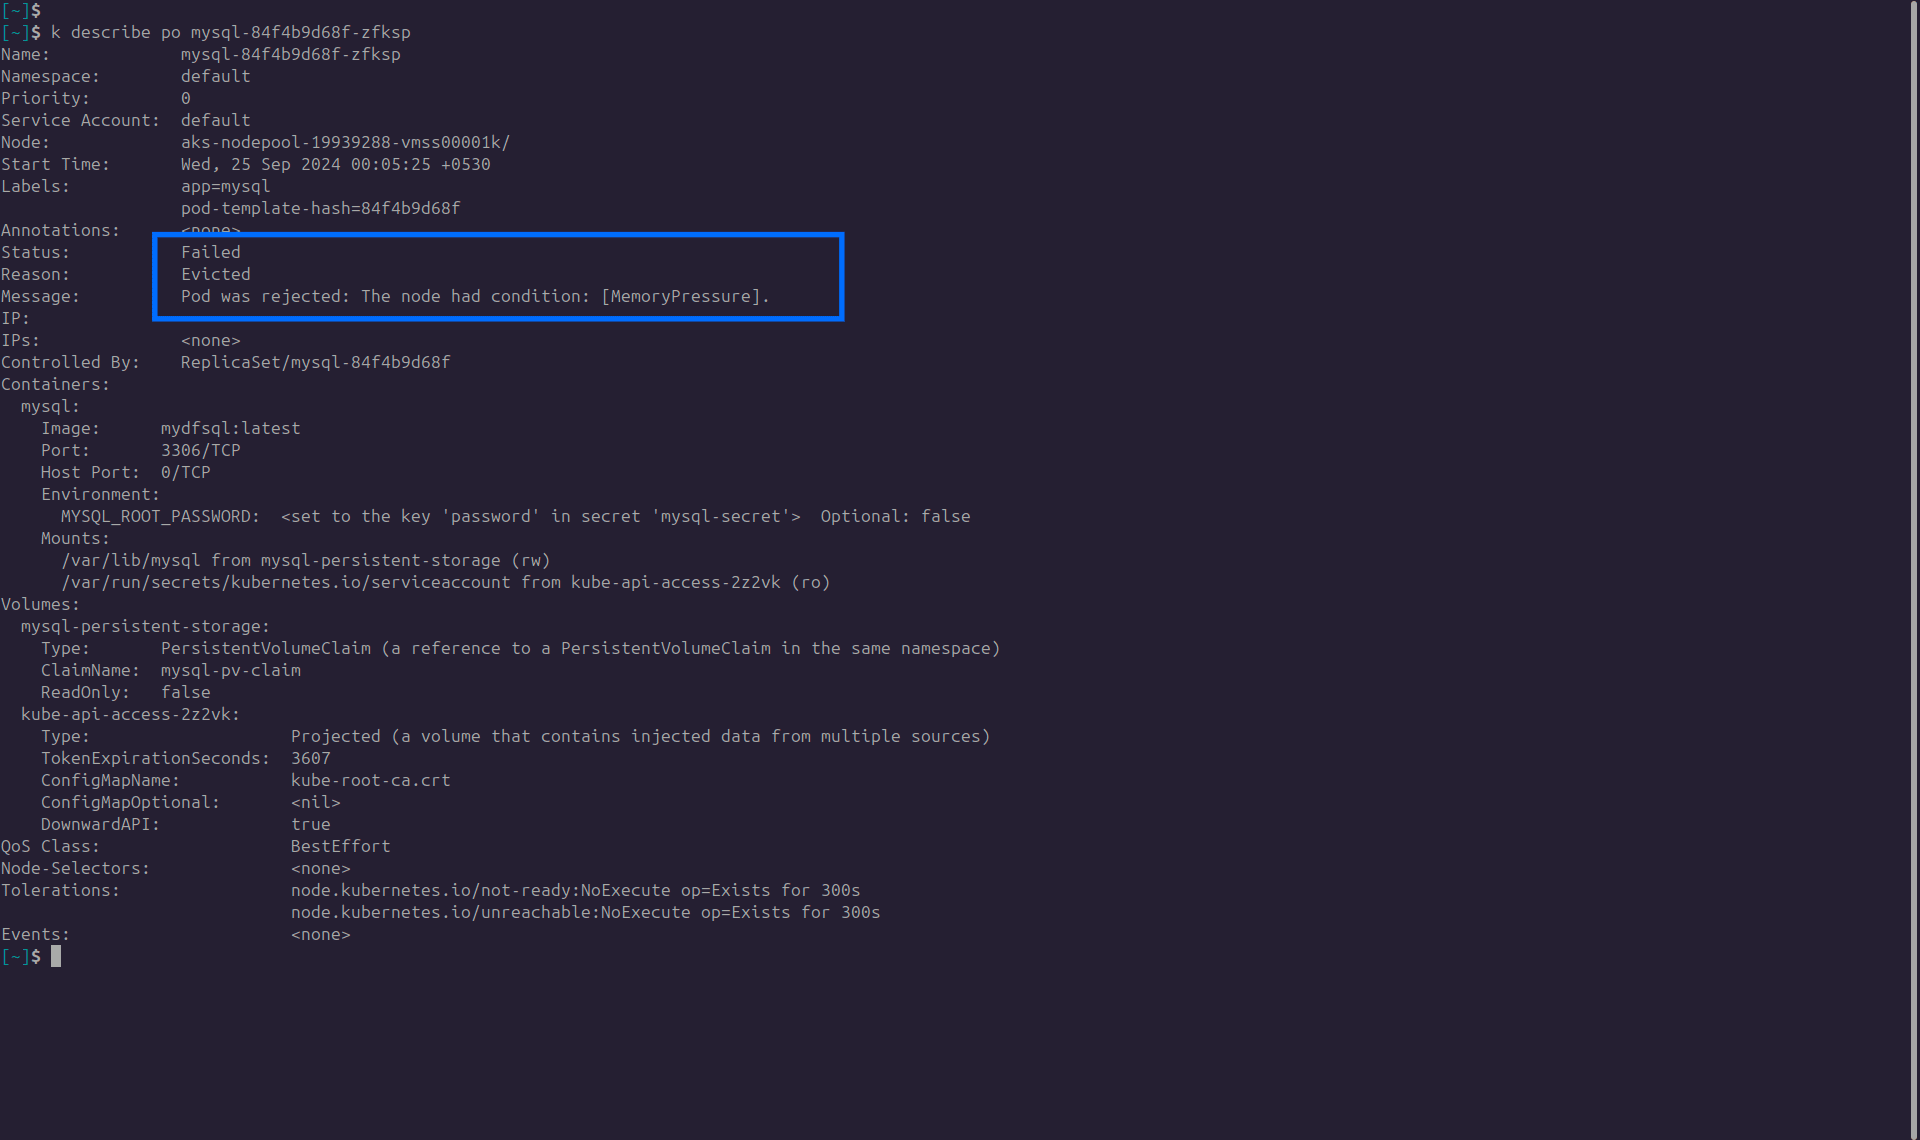
The first and basic debugging step would be to use kubectl describe pod <PENDING_POD_NAME>, by running which you would get to know why a pod is stuck.
Let us see an example.
In the below screenshot, you can see that there is an event, that is the failure of the pending pod.
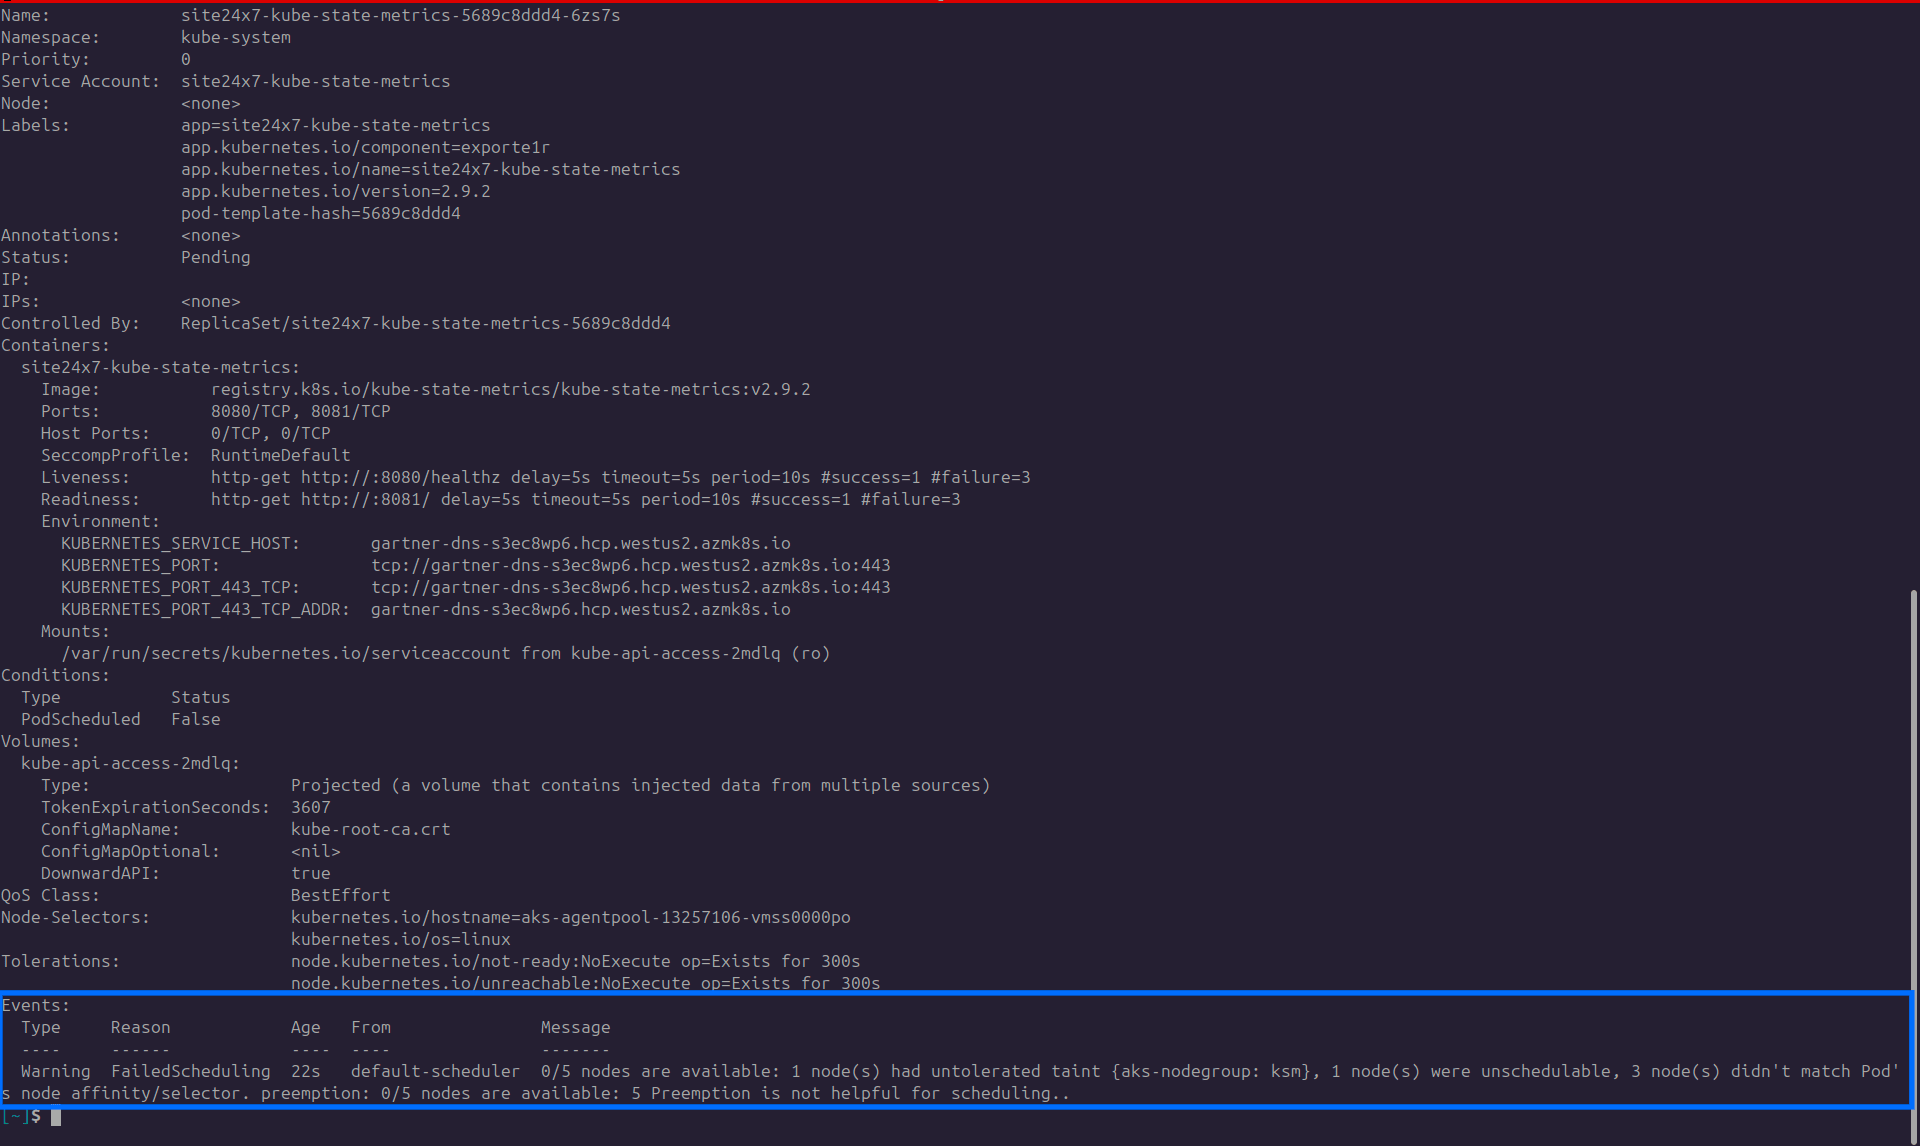
The screenshot above states that the pod is unable to schedule because there is a taint configuration.
Troubleshooting Tip: You can configure the pod with the necessary toleration.
Let us see another example:
Let us see another example:
This screenshot states that the pod is unable to schedule because there is no sufficient resource.
Troubleshooting tip: Increase the capacity of the node so that it can spawn the pod.
Okay. But how can you get notified about the pod pending failure as early as possible?
Usually, the problem may only become apparent when the user experience is affected because the application did not deploy correctly. This causes the pod to stop functioning due to any of the issues above.
However, you can avoid the user getting impacted as early as possible. All the noteworthy events related to your cluster will get registered in the Site24x7 Kubernetes event log report.
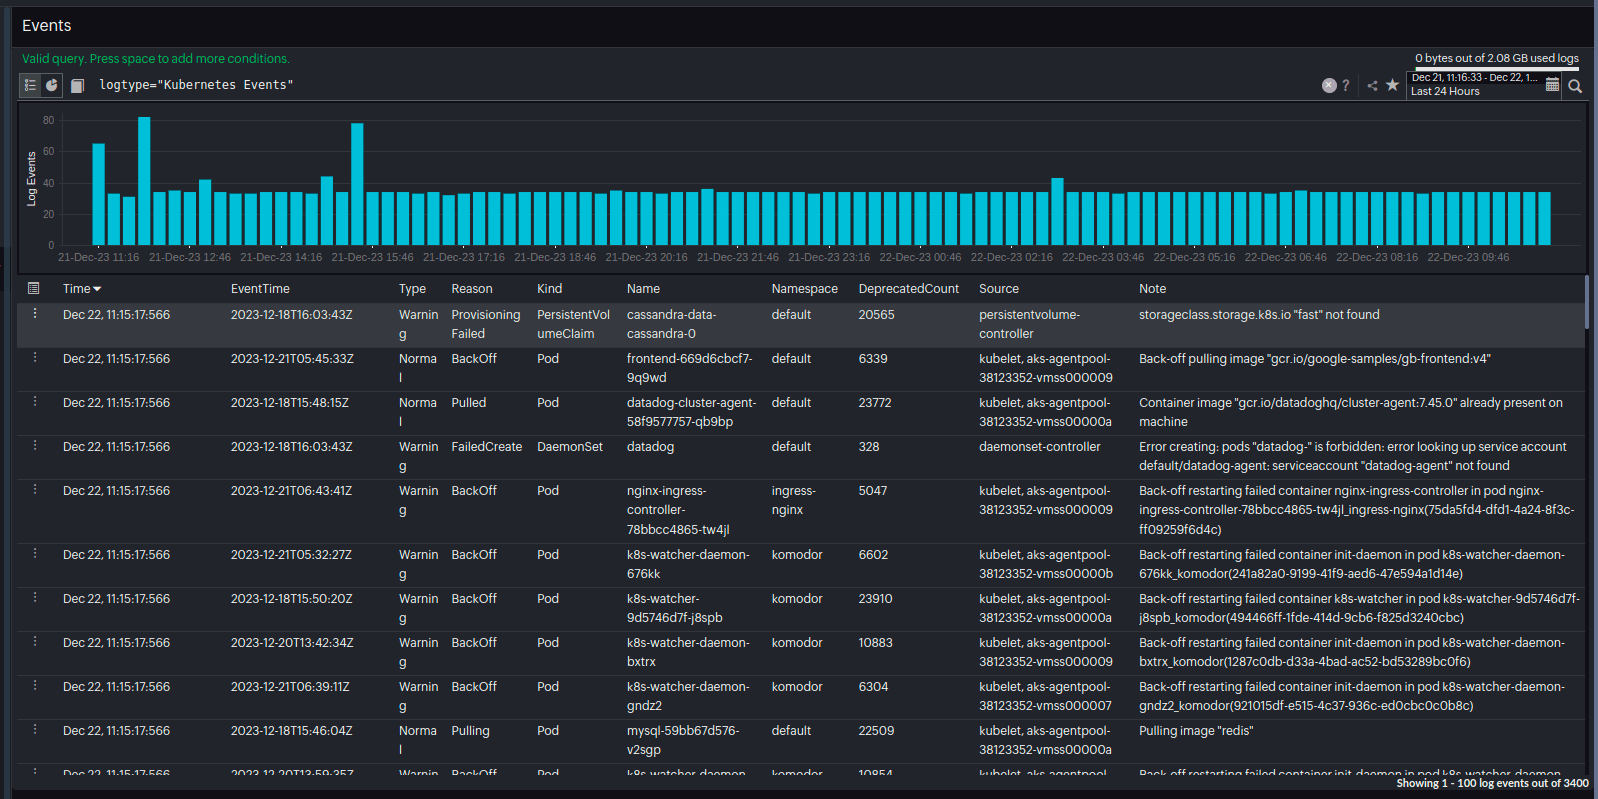
Site24x7 alerts you at the earliest about the unsuccessful pod that the Kubernetes administrators can inspect and fix the reason.
The best practice is to proactively monitor your entire Kubernetes infrastructure.
Ensure a healthy running Kubernetes environment by proactively tracking the pending pods and the critical KPIs including memory, CPU, and disk at the node level.
Investing time in monitoring and proactive problem-solving when managing large-scale Kubernetes deployments helps streamline operations and ensures smooth workload performance. This proactive approach will ultimately save significant operational headaches in the long run.
Site24x7 Kubernetes monitoring tool alerts the users whenever the pod is facing any lapse that would lead to a backslide in the application deployment. As soon as you set up your monitor, the tool would inspect your cluster setup, identify the vulnerabilities that would affect the effective functioning of your auto scaled environment, and alerts you so that you can inspect and troubleshoot before it affects your application deployment.
Explore Site24x7's Kubernetes monitoring tool and address your pod pending failure issues to ensure that your Kubernetes setup is always up and running!
Explore Site24x7's Kubernetes monitoring tool and address your pod pending failure issues to ensure that your Kubernetes setup is always up and running!
Comments (0)