by Jenifer P
Greetings!
When running Kubernetes workloads, identifying the root cause of a container resource spike can be challenging. A sudden increase in CPU or memory usage often leaves you wondering which process inside the container is responsible.
Until now, answering that question typically meant shelling into the container and running manual commands, even in the middle of an incident.
To resolve this issue, we now support process-level monitoring for Kubernetes containers, giving you visibility into the processes consuming resources without manual intervention.
Why does it matter?
- Root cause: Pinpoint the exact process responsible for increased resource utilization within a container, helping you quickly identify the source of the issue.
- Deeper metrics: Correlate aggregate container metrics with individual internal processes to eliminate visibility gaps, so you understand which processes contribute to overall resource consumption.
- Full coverage: Monitor short-lived executions, including health-check probes and initialization scripts, alongside primary workloads, helping you identify transient processes that may impact container performance.
Getting started
Container process monitoring requires the Full Stack Agent version 22.3.00 or above. If you're on an earlier version, upgrade your agent to unlock this feature.
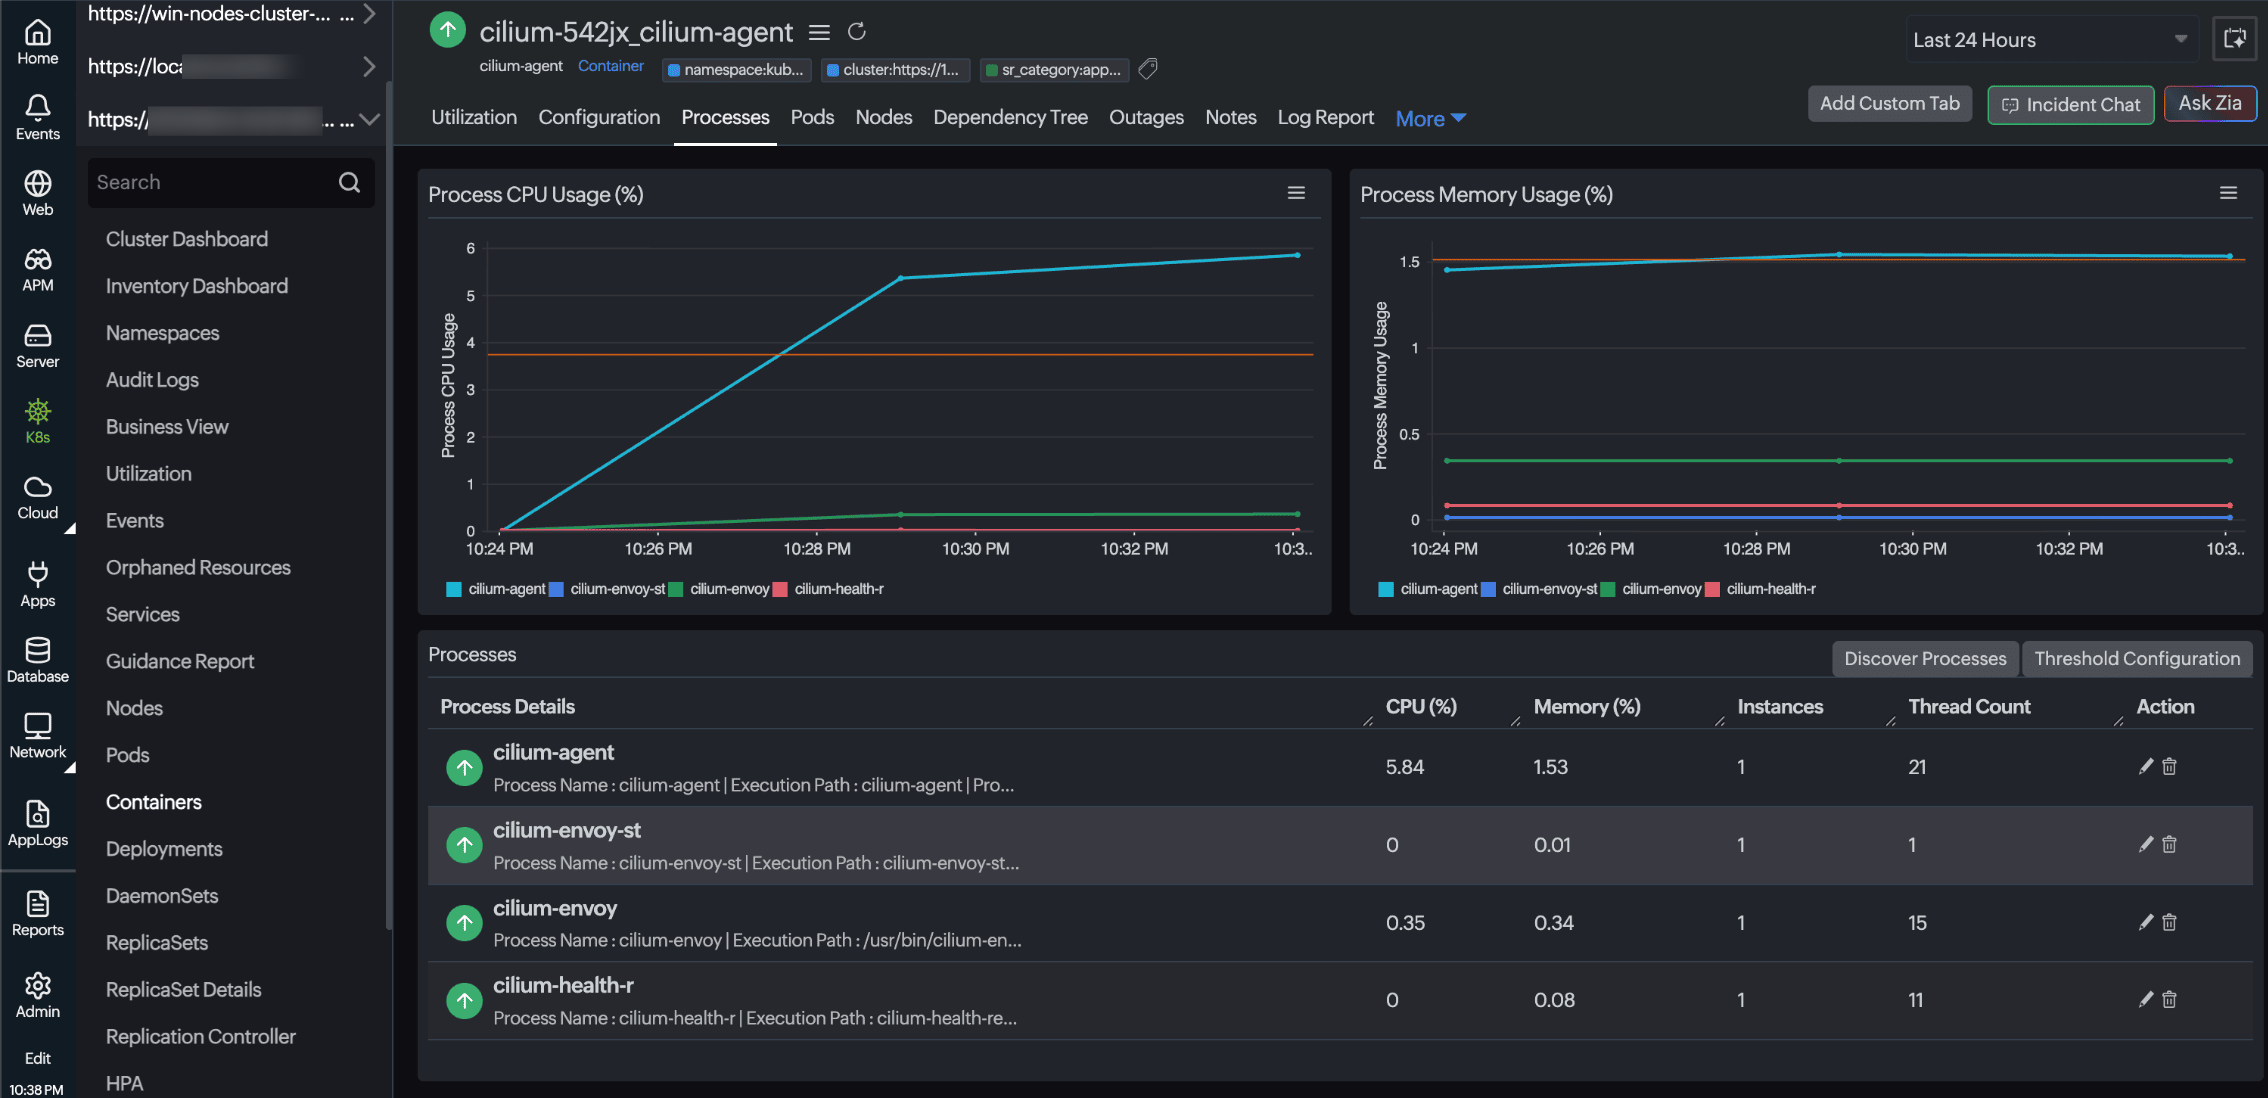
For more details, check out our help documentation for container process monitoring.
Do you have any thoughts or questions? Feel free to share them in the comments below!
Regards,
The Site24x7 team
Like (0)
Reply
Replies (0)