by Timur
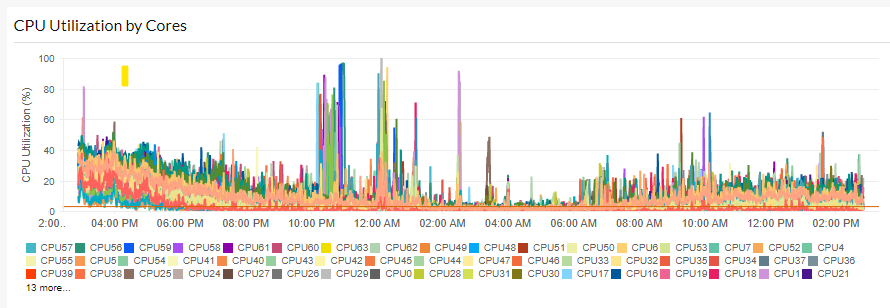
Hello, I am using the Custom dashboard Multi Attribute Widget to graph some database values on one chart. But it seems the only option is for a stacked line chart. IE - the multiple values stack on top of each other instead of displaying across one axis value.
Is there any way to make the multiple values NOT stack, similar to your CPU chart below. If I have 4 lines with the value of 20, I want all of them to be on the same horizontal line, not adding the values up like 20-40-60-80.

Like (1)
Reply
Replies (1)