Greetings!
We are pleased to announce that we've enhanced the Tomcat monitoring plugin with an improved interface and additional metrics, providing you with greater insights into your Tomcat servers' performance.
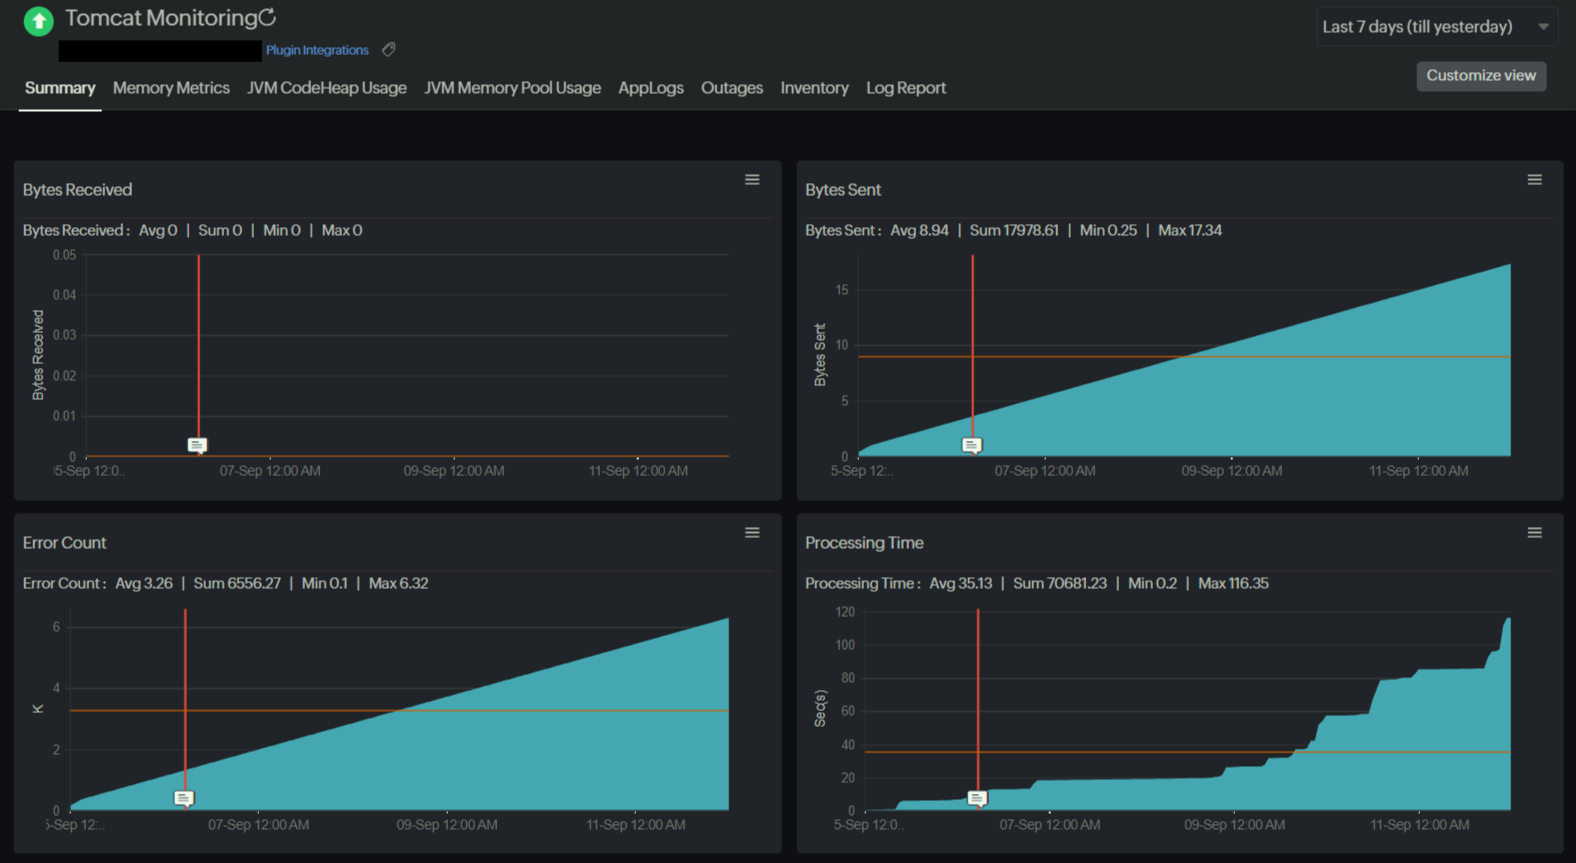
Consolidated metrics and tab support for comprehensive visibility
The updated plugin combines the metrics from three different Tomcat plugins (Tomcat Connector, Tomcat Memory Pool, and Tomcat Overall Memory) into one. The new interface now includes dedicated tabs for Summary, Memory Metrics, JVM Code Heap Usage, and JVM Memory Pool Usage in a unified dashboard.
With the updated plugin, you can:
- Enhance resource management and capacity planning: Monitoring metrics like Available, Used, Max, and Total Memory helps track JVM memory usage, ensuring efficient allocation and preventing issues like memory leaks or over-allocation that can cause crashes or lag.
- Improve application performance: Monitoring Processing Time, Request Count, Thread Count, and Thread Busy metrics helps identify server bottlenecks and ensures efficient request handling during peak traffic.
- Detect issues proactively: Tracking the Error Count metric helps identify server issues early, allowing proactive fixes to reduce downtime and improve system stability.
- Ensure network efficiency and server scalability: Monitoring thread and network metrics helps manage server scalability, improve data handling, and ensure optimal performance under increased loads without degradation.

Visit our GitHub repository and follow the steps in the README file to install the enhanced Tomcat plugin.
Feel free to send in your feedback on the enhancement in the comments section below.
Happy monitoring,
The Site24x7 team
Like (1)
Reply
Replies (0)