JVM metrics
Gain useful insights into runtime data to troubleshoot performance issues and monitor your application's health with Java Virtual Machine (JVM) metrics. The Site24x7 APM Insight Java agent captures JVM metrics by default.
All visualizations available on the JVM tab include indicators for the maximum, minimum, 95th percentile, and average values. These indicators provide users with a quick overview of the JVM's performance across various aspects.
To view the JVM metrics in the client:
- Log in to your Site24x7 web client.
- Navigate to APM, select your Java application, and click the JVM tab.
- Select the time frame for which you need the metrics.
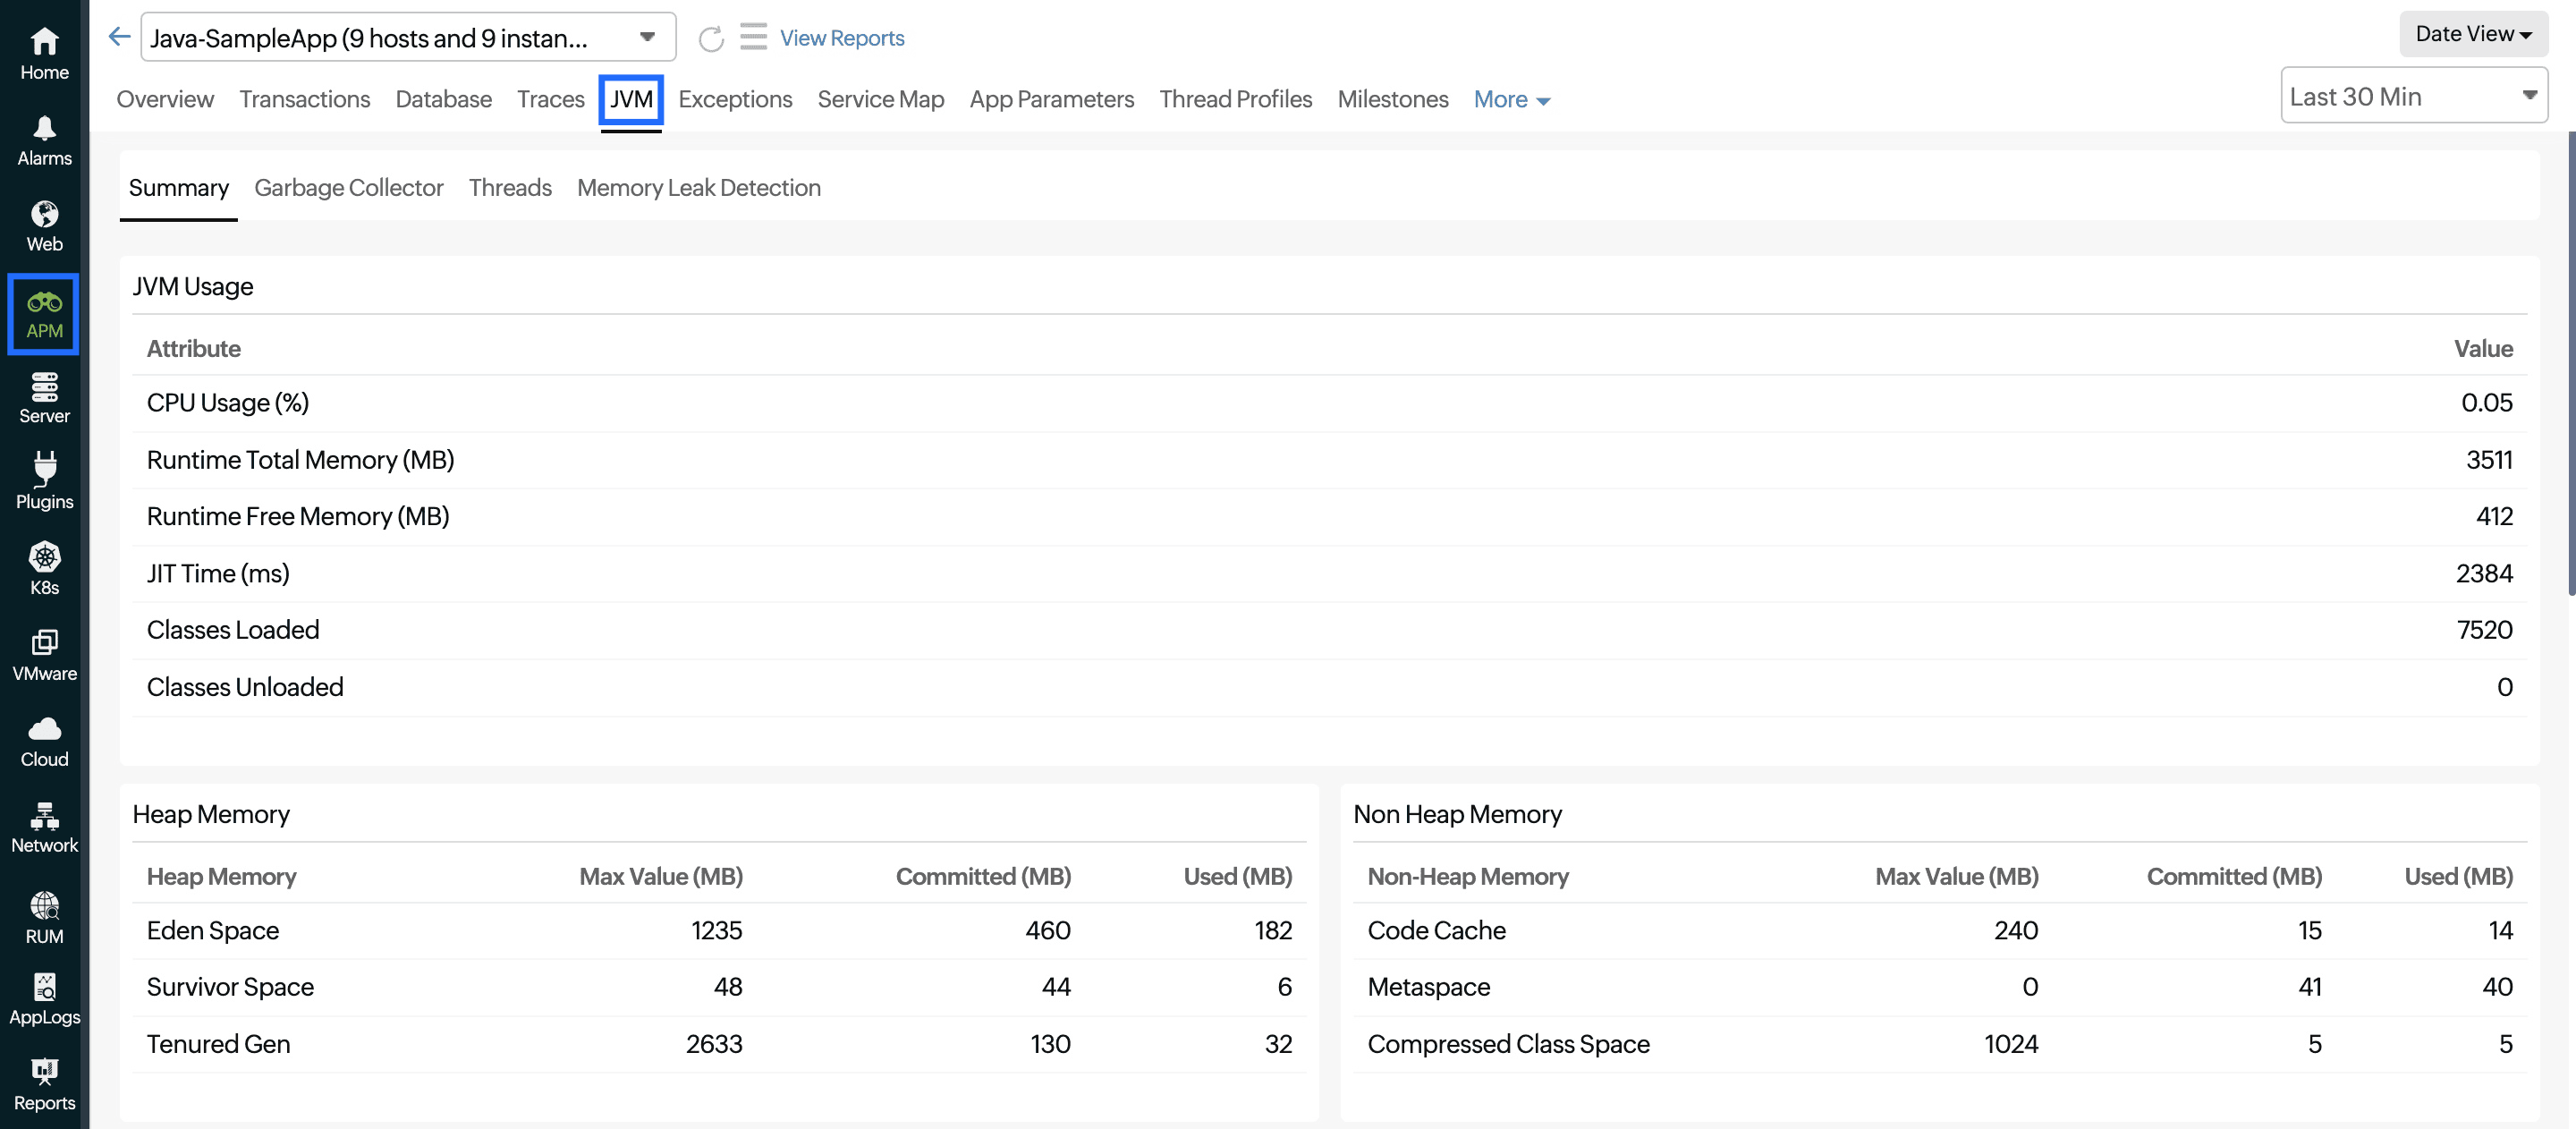
Summary
The JVM Usage section provides the following key performance metrics:
| Parameter | Description |
|---|---|
| CPU Usage (%) | The percentage of the CPU utilized by the JVM |
| Runtime Total Memory (MB) | The maximum amount of memory that the JVM can use |
| Runtime Free Memory (MB) | The amount of free memory available within the JVM |
| JIT Time (ms) | The time taken for JIT compilation |
| Classes Loaded | The number of classes loaded into the JVM |
| Classes Unloaded | The number of classes unloaded from the JVM |
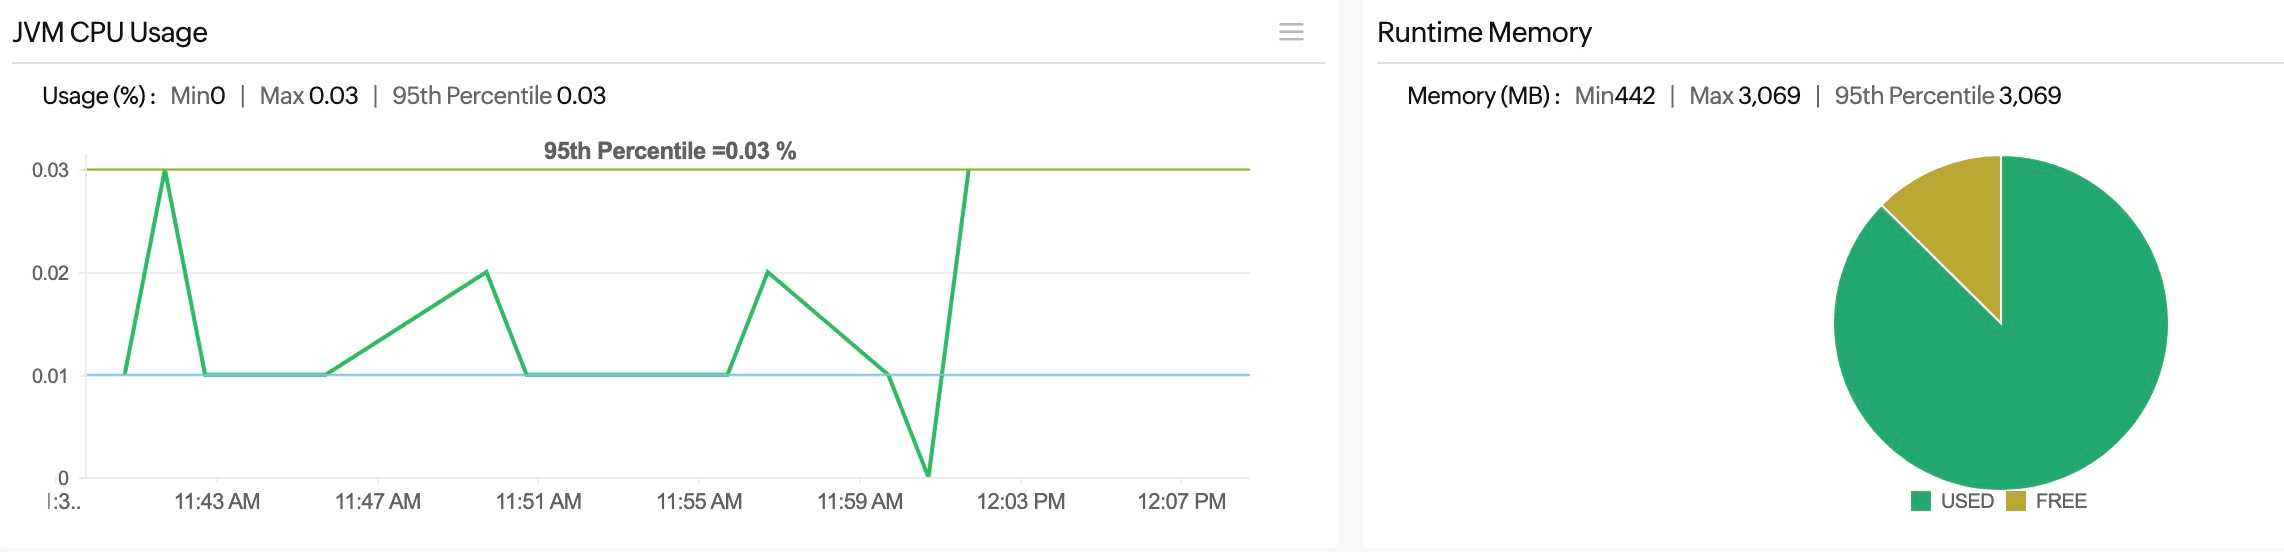
JVM CPU Usage
This graph shows the CPU usage percentage of the JVM over a specified time period.
Runtime Memory
This pie chart illustrates the distribution of memory usage within the JVM.
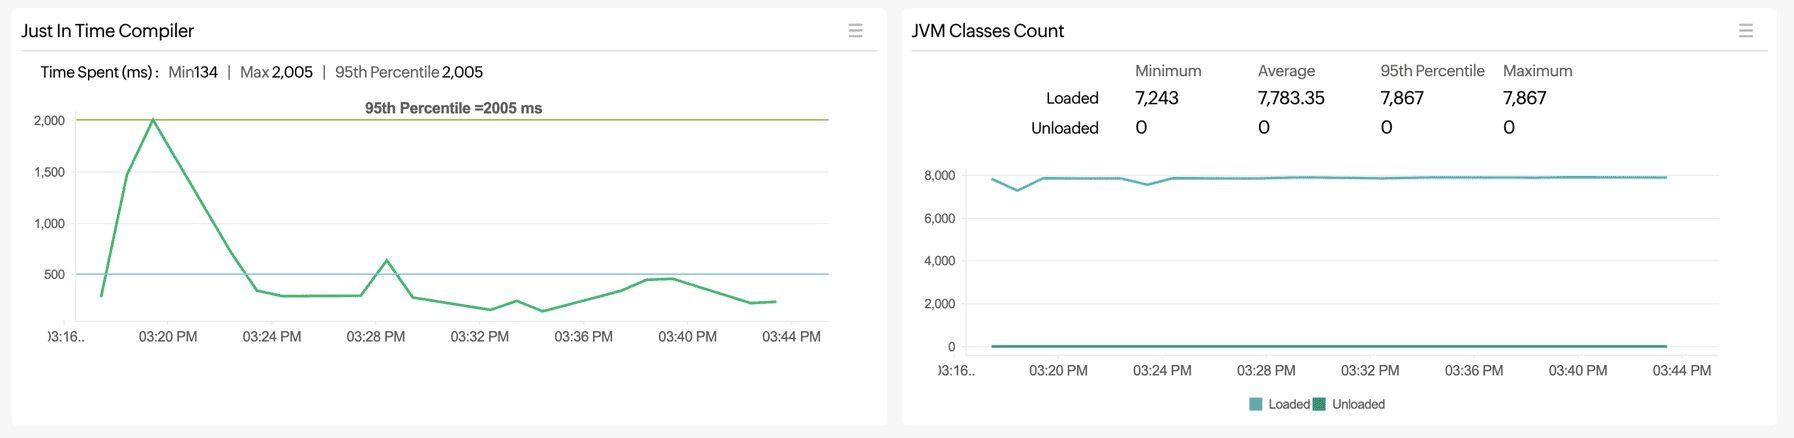
Just In Time Compiler
This graph visualizes JIT compilation over time, allowing users to identify spikes in the compilation activity. The green line represents the 95th Percentile, showing that 95% of the compilation times are below this value.
JVM Classes Count
This graph visualizes the number of loaded and unloaded classes over time, providing insights into the JVM's class loading behavior.
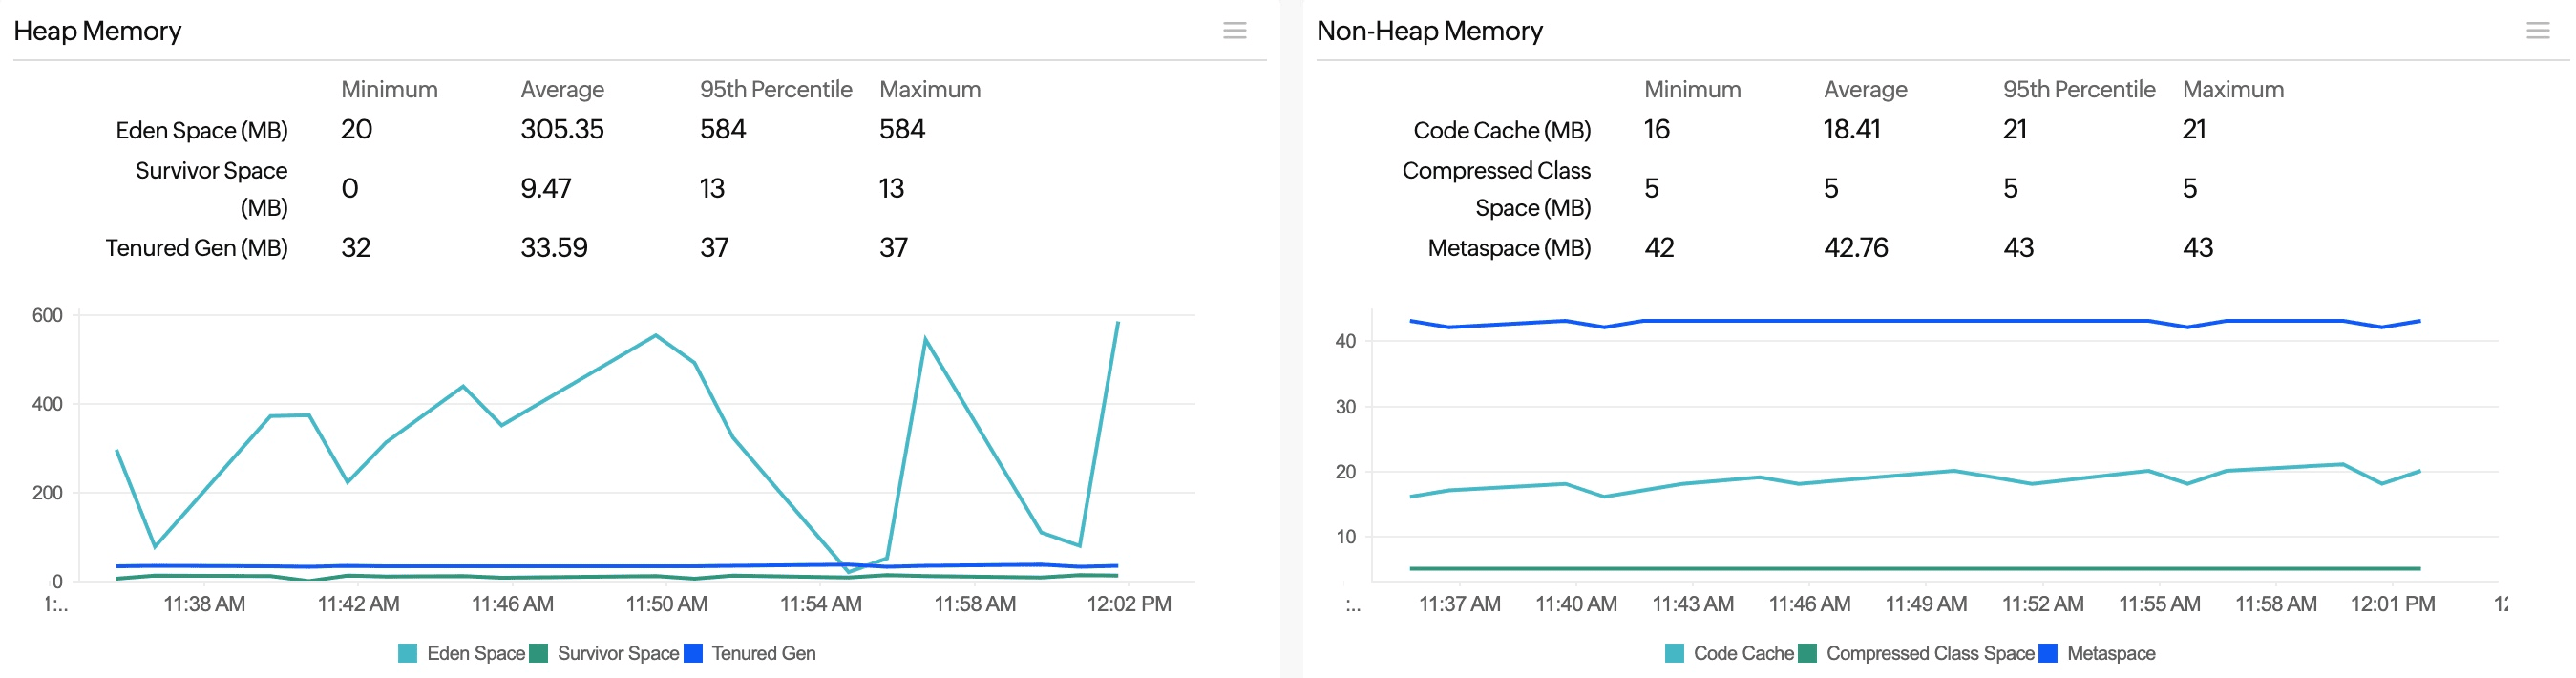
Heap Memory and Non-Heap Memory
Memory pools that the JVM creates are categorized into heaps and non-heaps.
These graphs visualize the trends in memory usage throughout the set time window.
Garbage Collector
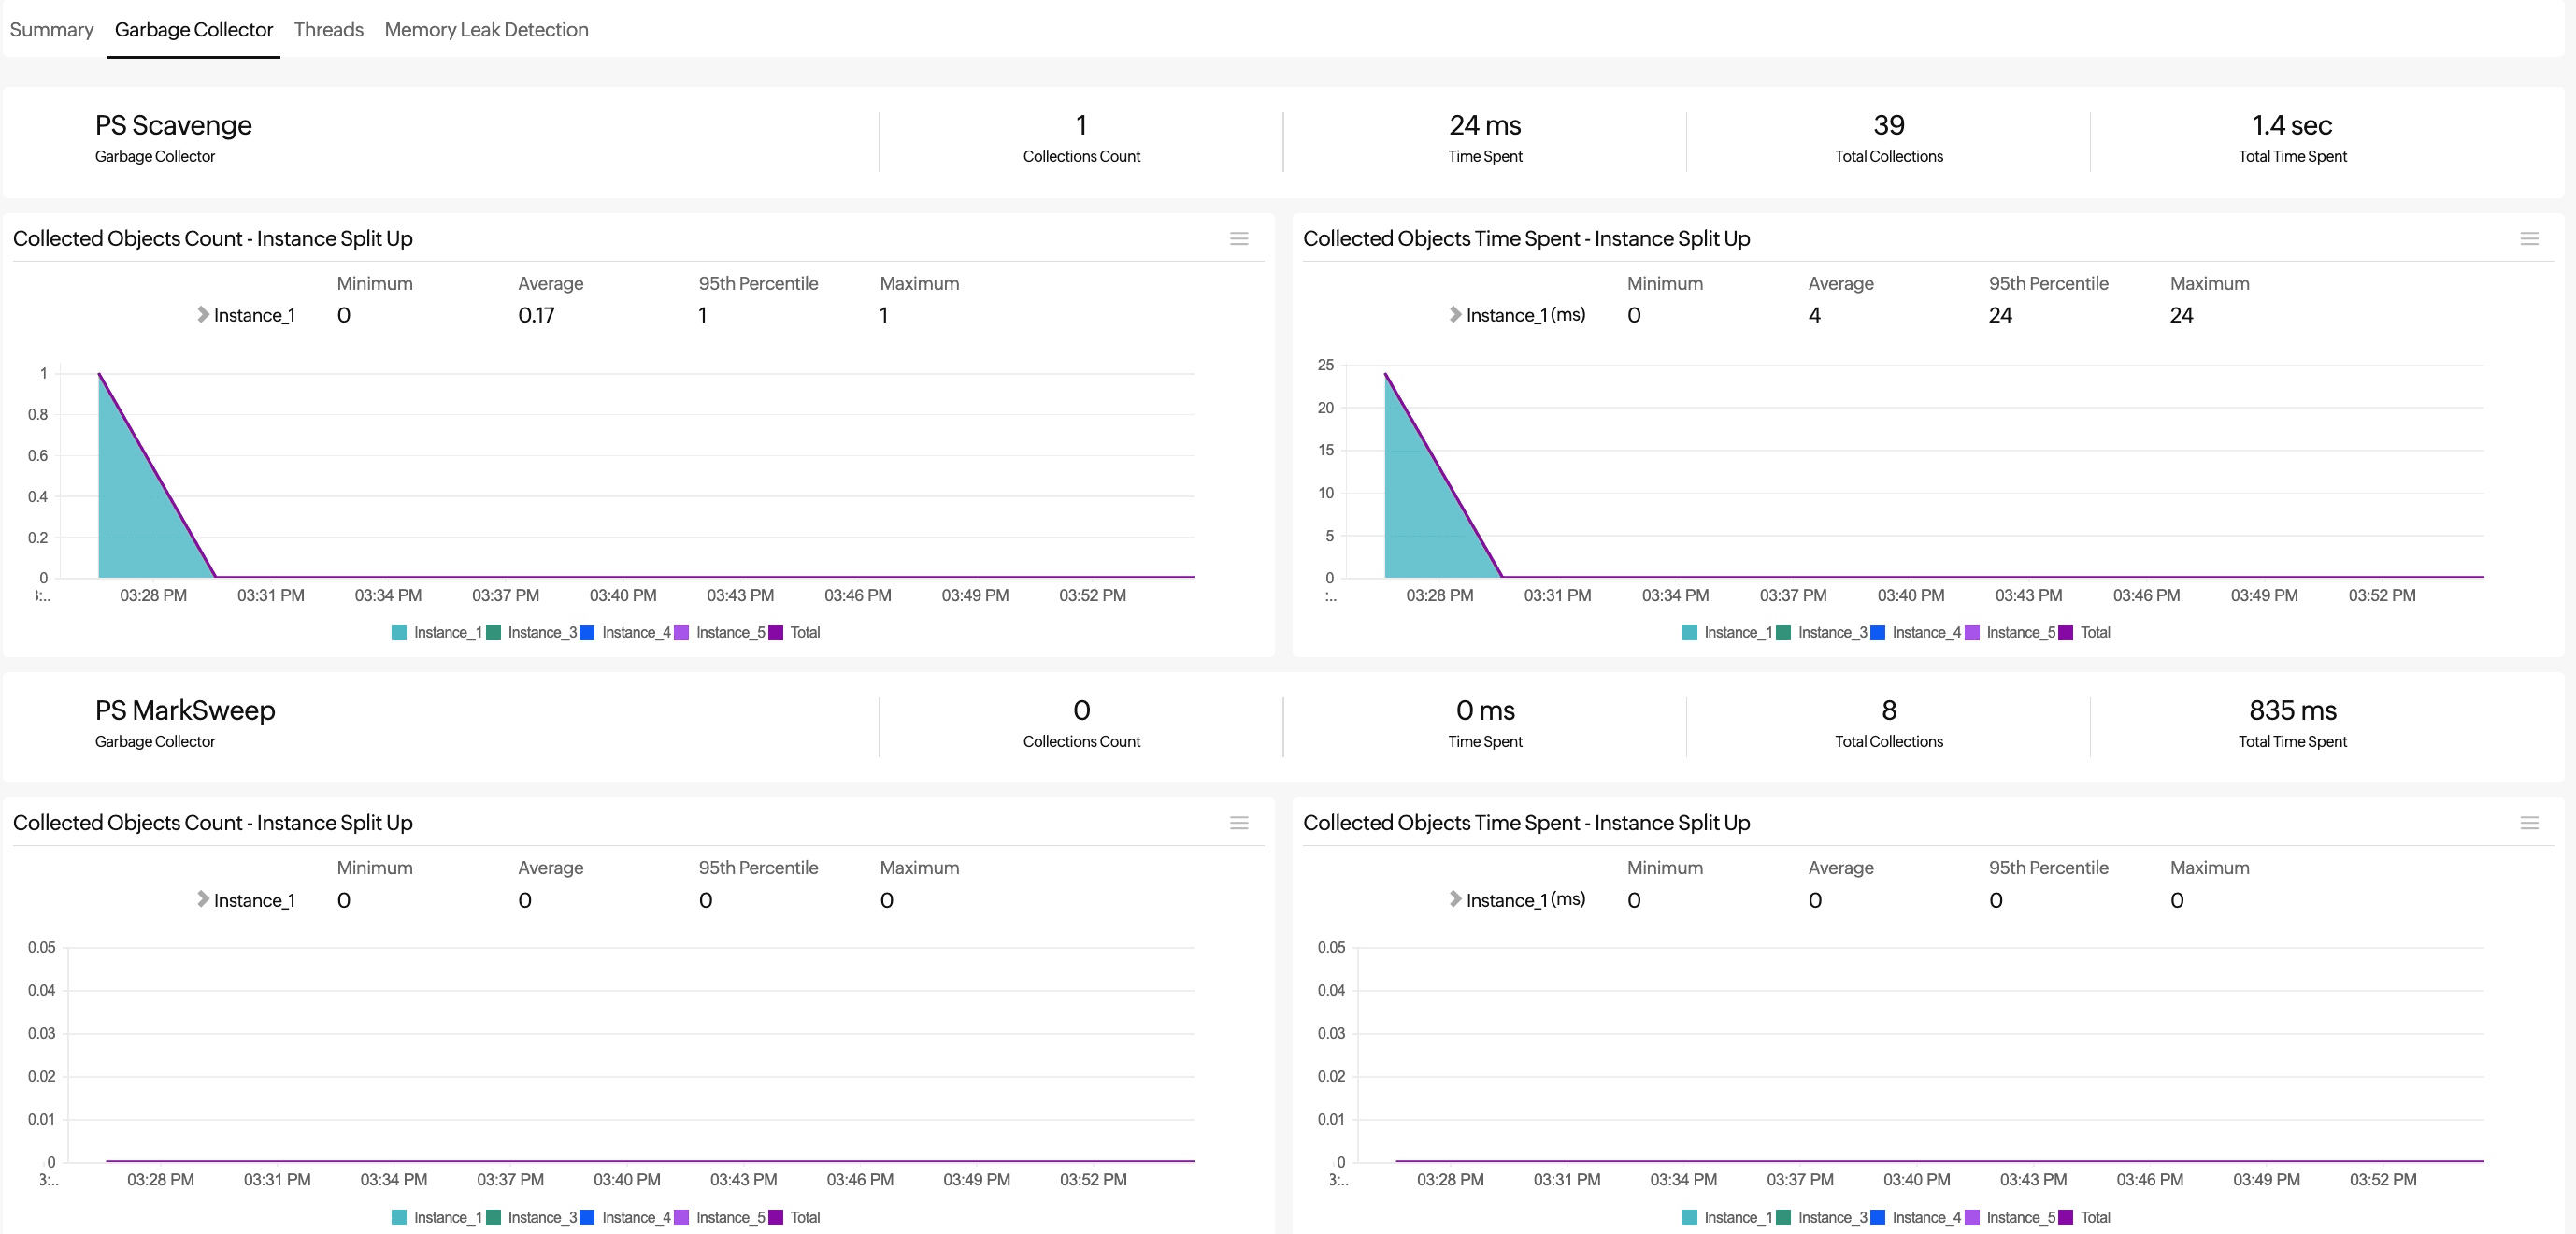
This tab provides insights into the behavior and performance of the JVM's garbage collection processes. The garbage collection metrics help you gain insights into the objects the JVM collects for cleanup.
Based on this information, you can optimize your application's performance by reducing the garbage collection time as much as possible. A reduced garbage collection time can help you achieve high throughput for application tasks. Additionally, a lower garbage collection time means reduced usage of system resources for garbage collection itself, further enhancing your overall system efficiency.
The top band displays the following metrics:
| Parameter | Description |
|---|---|
| Collections Count | The number of garbage collection events that have occurred within a specified period |
| Time Spent | The total amount of time spent on garbage collection activities within the specified period |
| Total Collections | The cumulative number of garbage collection events that have occurred |
| Total Time Spent | The cumulative amount of time spent on garbage collection activities |
Collected Objects Count - Instance Split Up
This graph shows the count of collected objects for each instance of garbage collection. Different colors represent different instances.
Collected Objects Time Spent - Instance Split Up
This graph shows the time spent on garbage collection for each instance. Different colors represent different instances.
You can see separate sections for each garbage collector on the JVM.
Threads
The Threads tab provides detailed insights into the thread activity within the JVM.
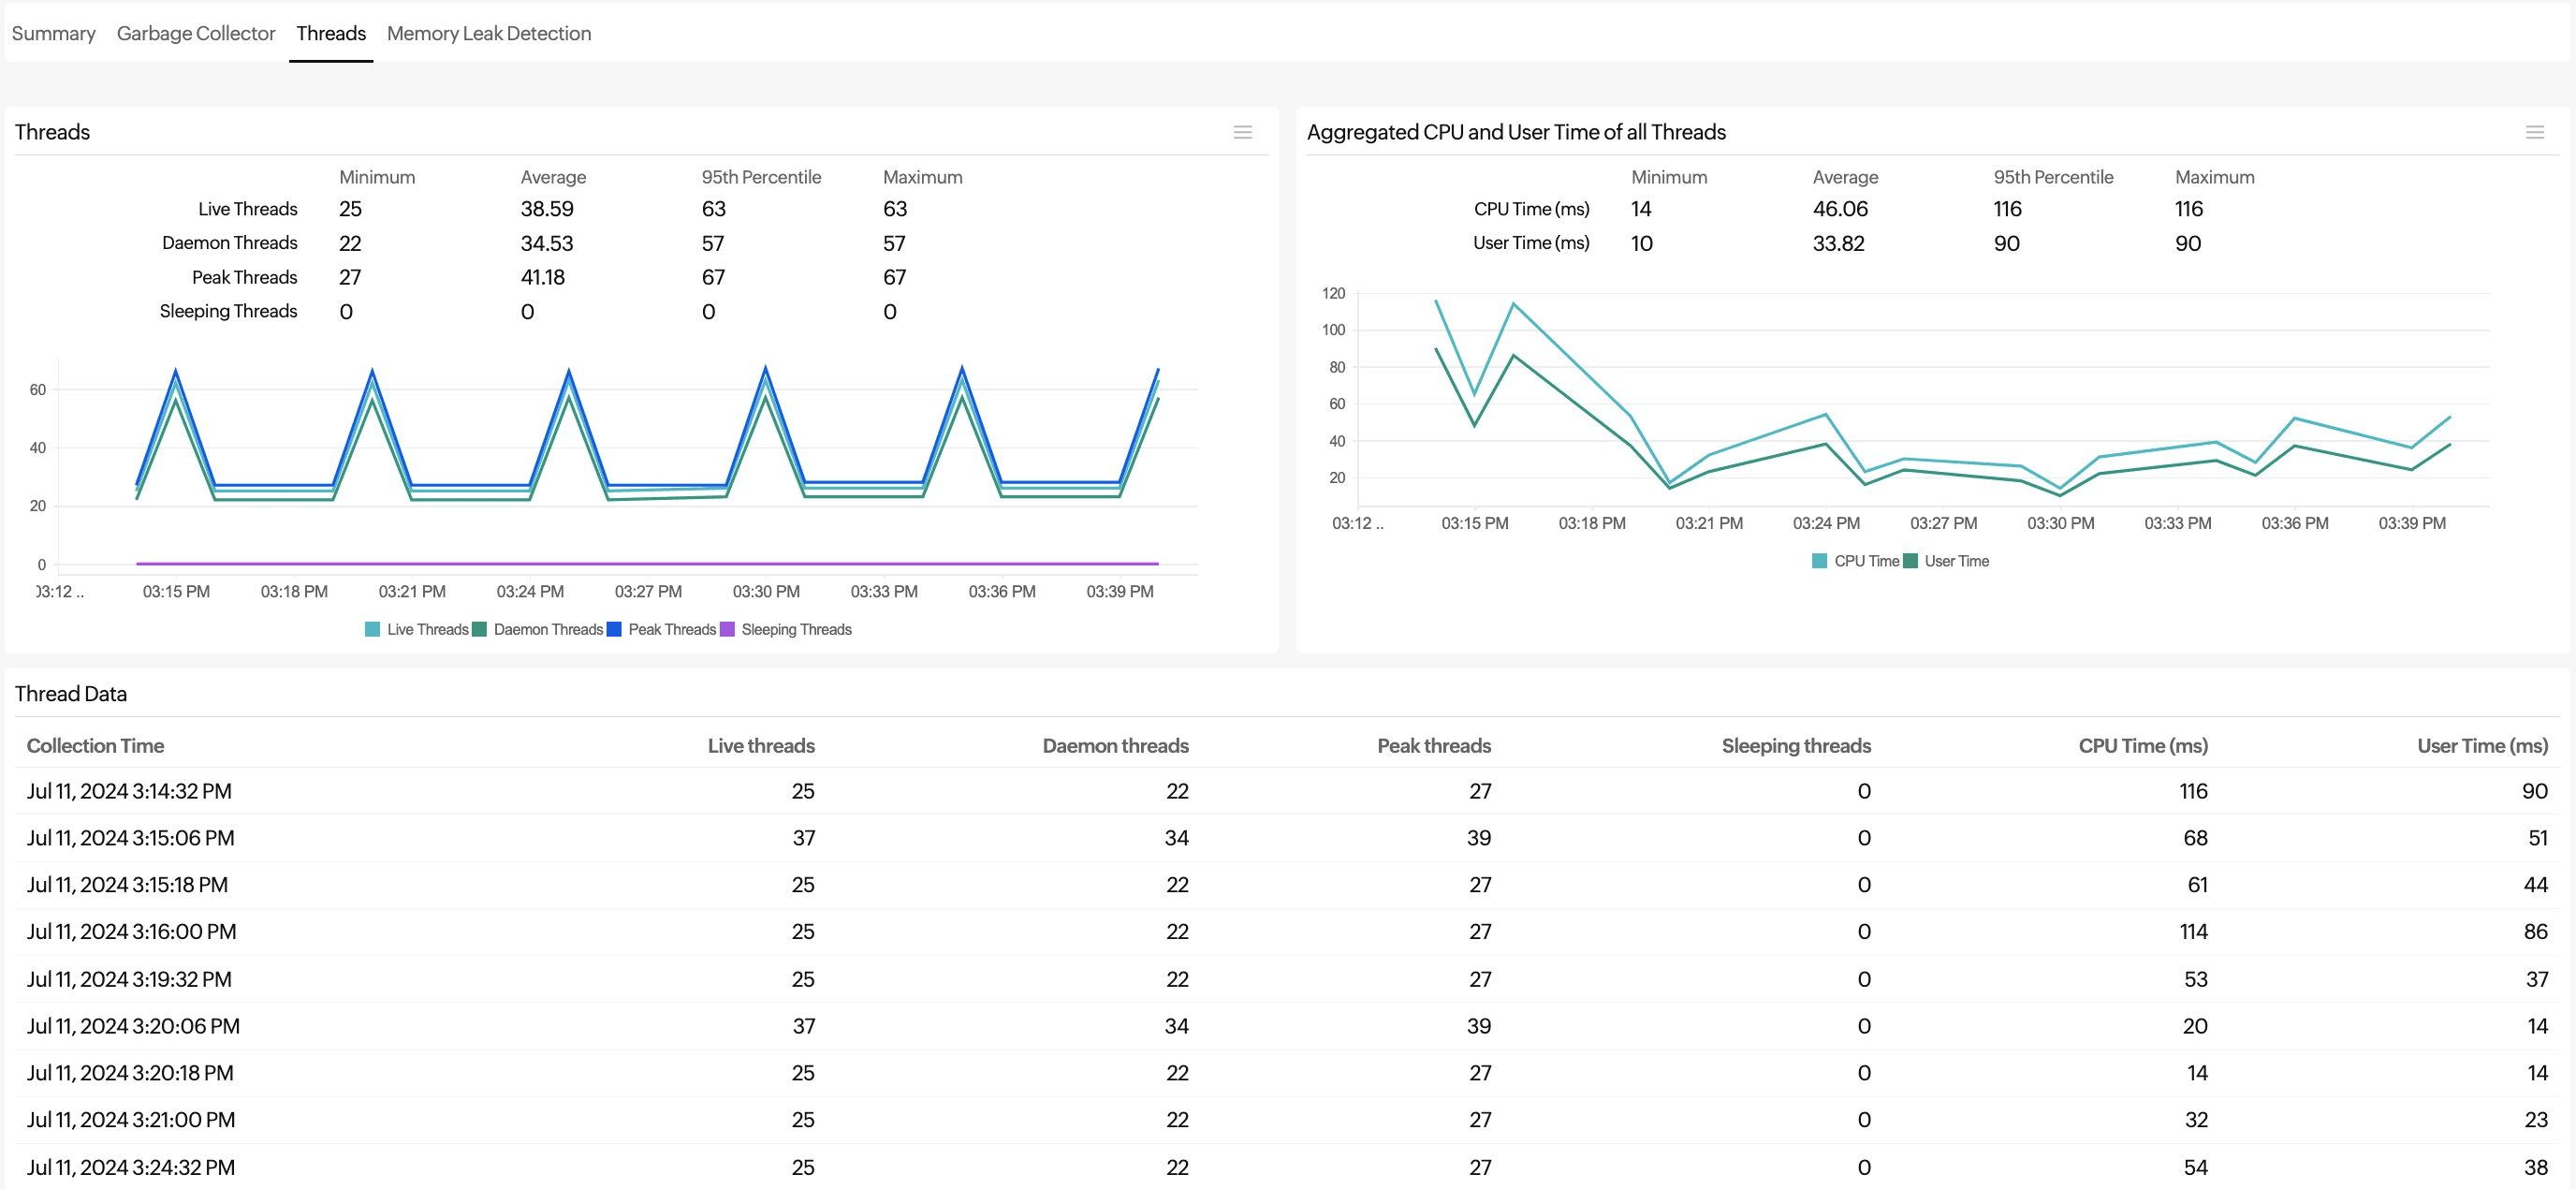
Threads
This graph visualizes the thread activity over time. Different colors represent different thread states.
Aggregated CPU and User Time of all Threads
This graph shows the total CPU and user time consumed by all the threads over the observed period.
Thread Data
This table provides detailed, timestamped data on thread activity.
| Parameter | Description |
|---|---|
| Collection Time | The timestamp of data collection |
| Live threads | The currently running daemon and non-daemon threads |
| Daemon threads | The background threads that perform tasks such as garbage collection and support the main execution |
| Peak threads | The maximum thread count since the JVM started or the peak was reset |
| Sleeping threads | The threads that are paused from execution |
| CPU Time (ms) | The CPU time consumed by all the threads at each collection point |
| User Time (ms) | The user time consumed by all the threads at each collection point |
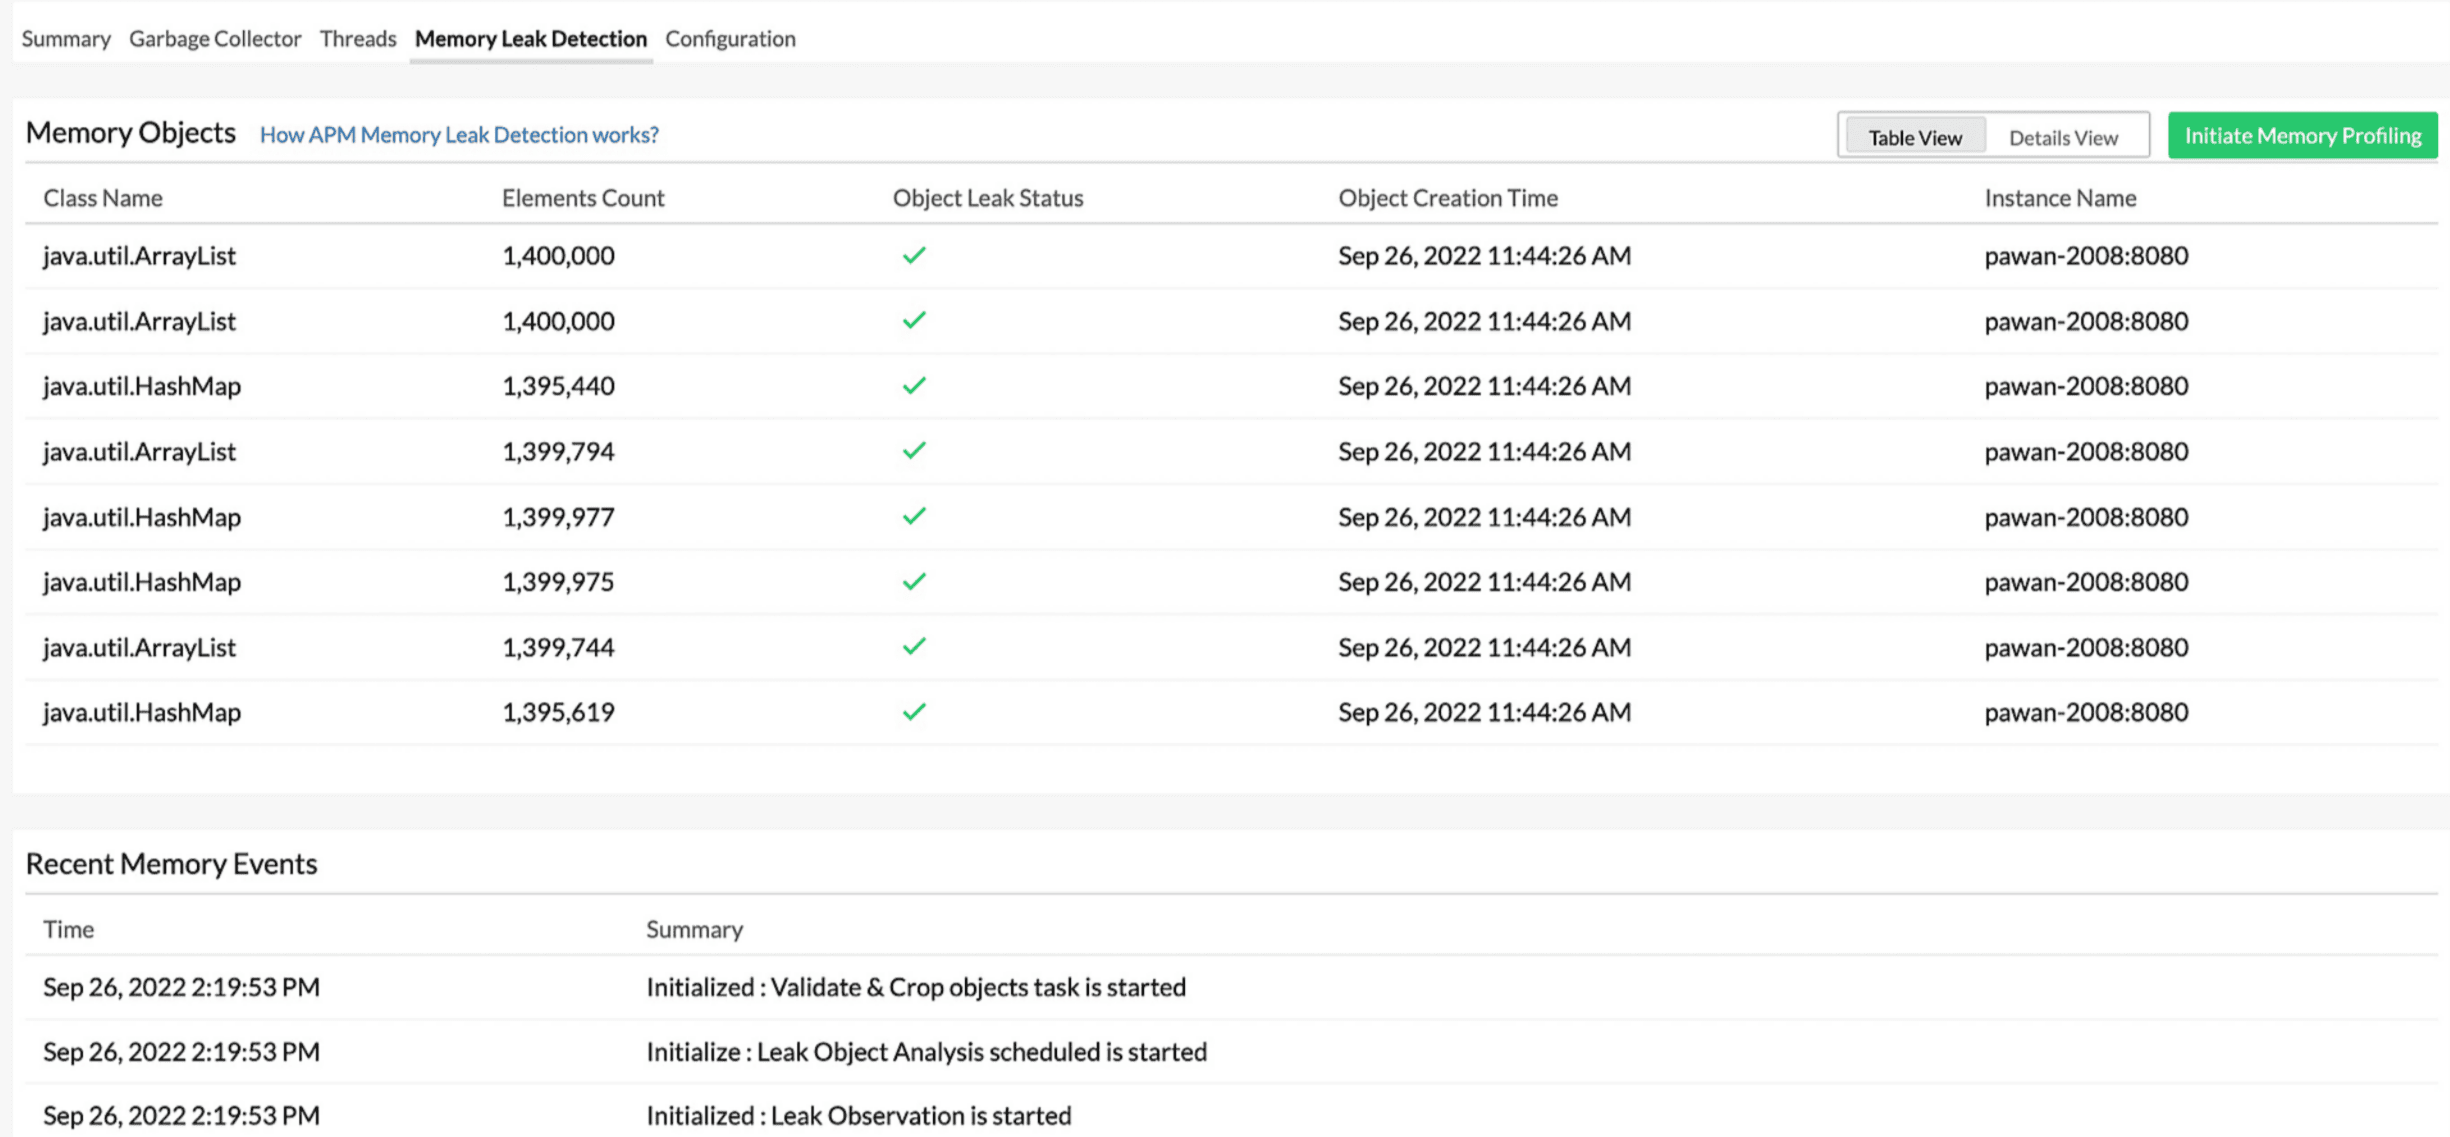
Memory Leak Detection
This tab allows you to quickly detect and address memory leaks before they seriously impact your application's performance.
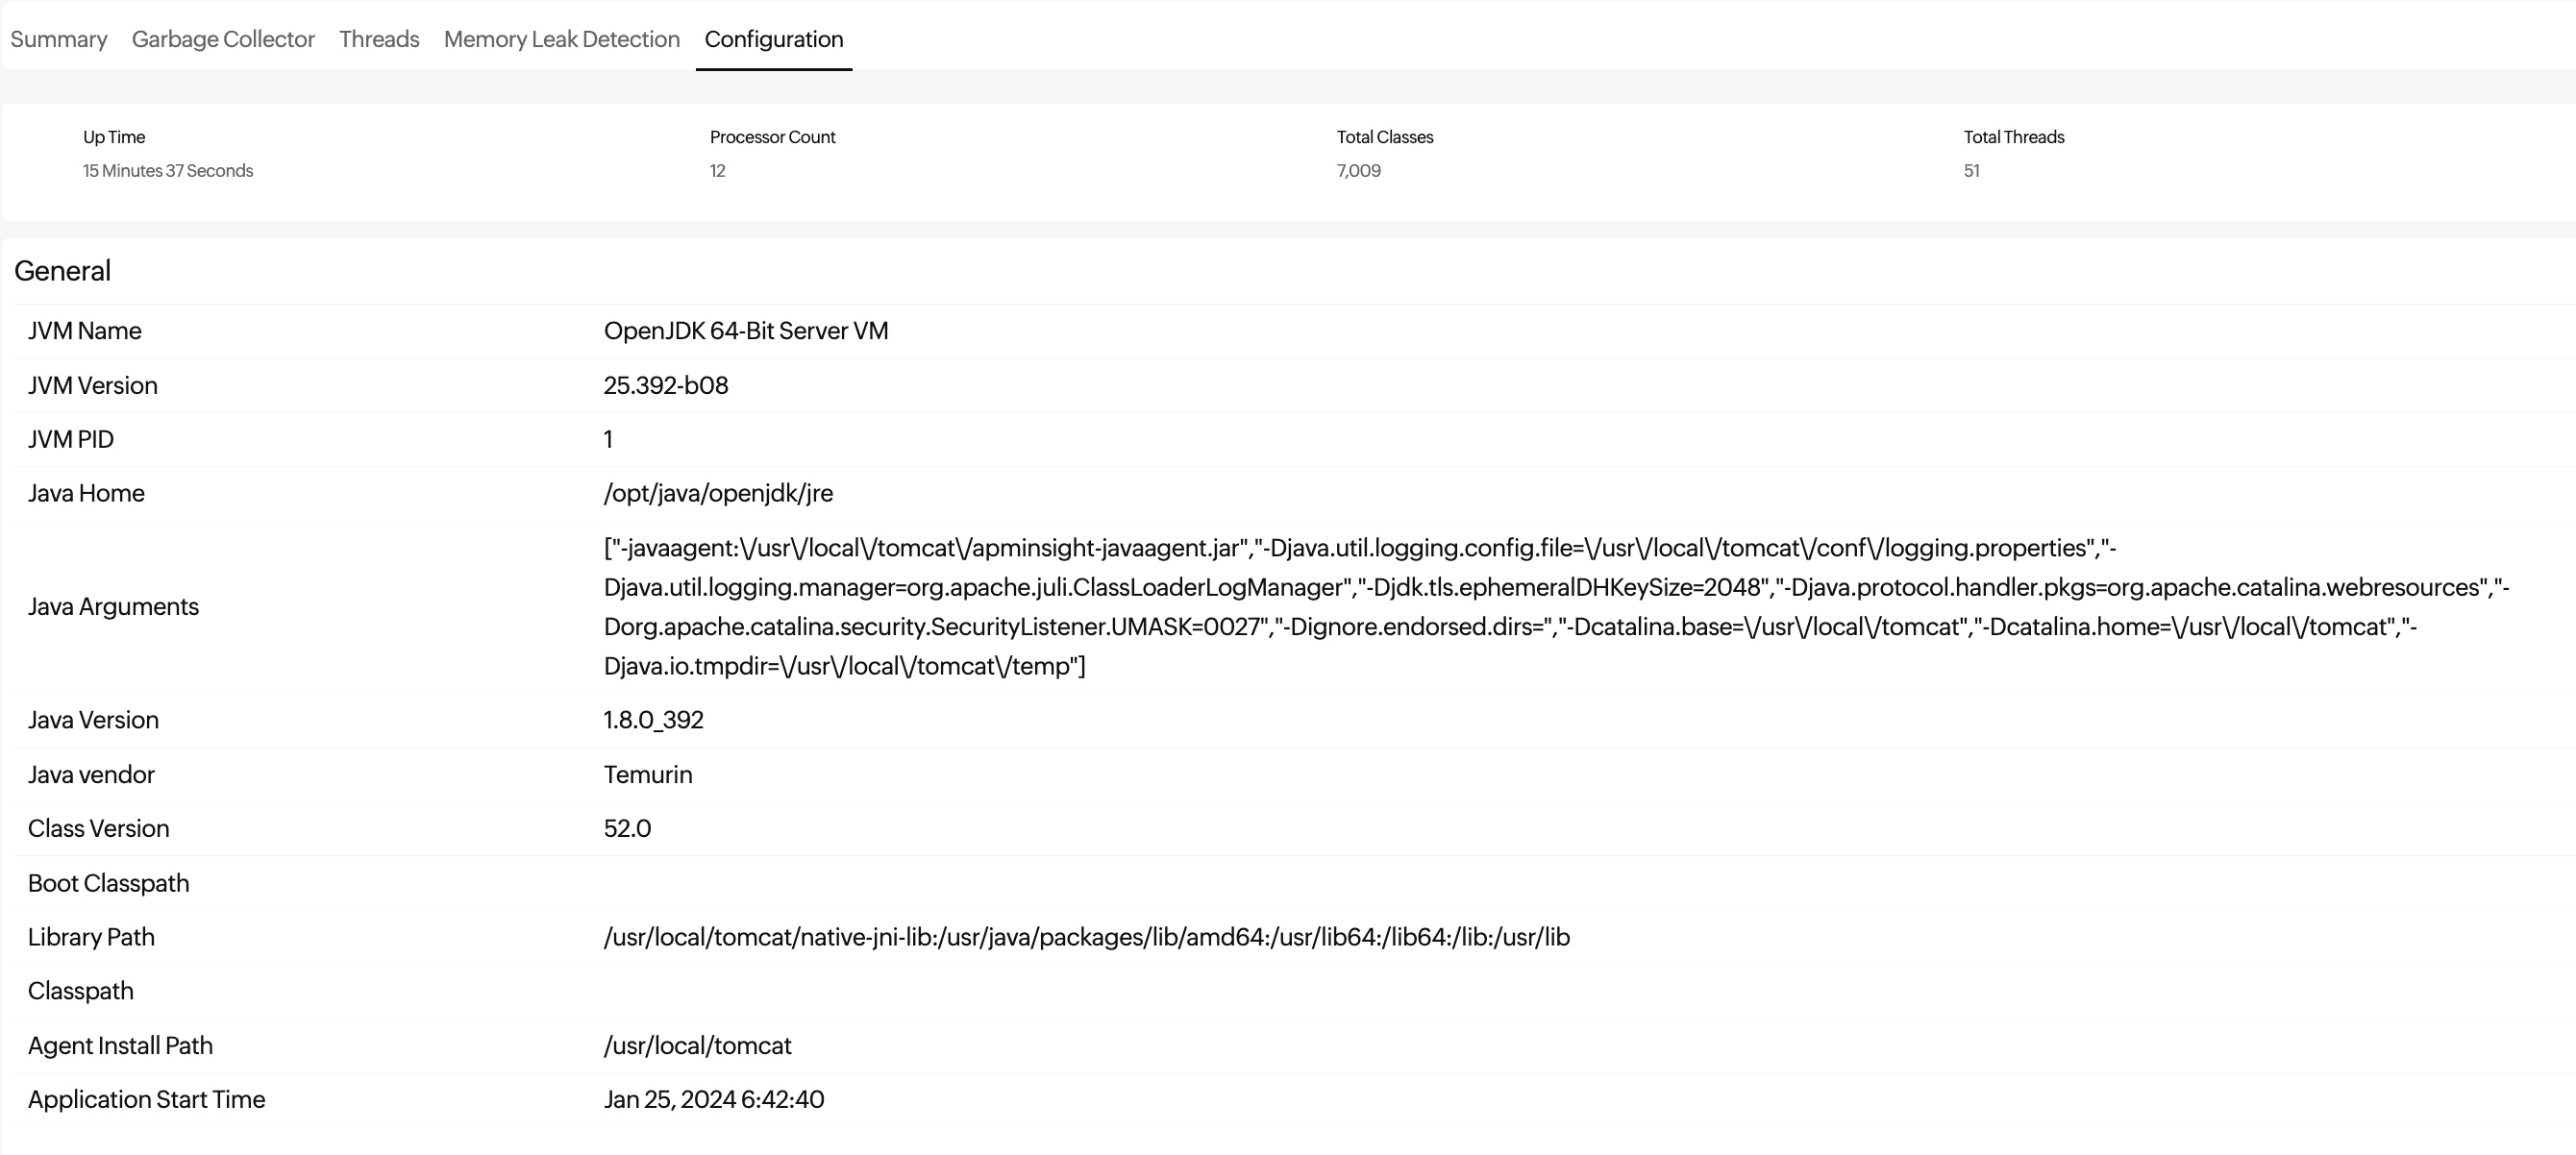
Configuration
The Configuration tab is available only at the instance level.
This tab provides a basic level of information, including metadata about the JVM of the current instance and the host environment.
The top band shows the following metrics:
| Parameter | Description |
|---|---|
| Up Time | The total duration for which the JVM has been running |
| Processor Count | The number of processors available to the JVM |
| Total Classes | The total number of classes loaded during the Up Time |
| Total Threads | The total number of threads spawned during the Up Time |
General
| Parameter | Description |
|---|---|
| JVM Name | The name of the JVM being used |
| JVM Version | The version of the JVM, including the build number |
| JVM PID | The process ID (PID) of the JVM instance |
| Java Home | The directory path where the JVM (JRE or JDK) is installed |
| Java Arguments | The list of arguments passed to the JVM during startup, including various configurations and properties |
| Java Version | The version of Java being used by the JVM |
| Java vendor | The organization that provides the Java implementation being used (e.g., Oracle, OpenJDK, or Eclipse Temurin) |
| Class Version | The version number of the Java class file format used by the JVM |
| Boot Classpath | The paths to the class files that are used by the JVM's bootstrap class loader |
| Library Path | The paths to the native libraries that the JVM can load |
| Classpath | The paths to the user classes and resources used by the JVM |
| Agent Install Path | The path where the Java agent file, apminsight-javaagent.jar, is added for monitoring the current instance |
| Application Start Time | The starting date and time of the JVM (in user time) |
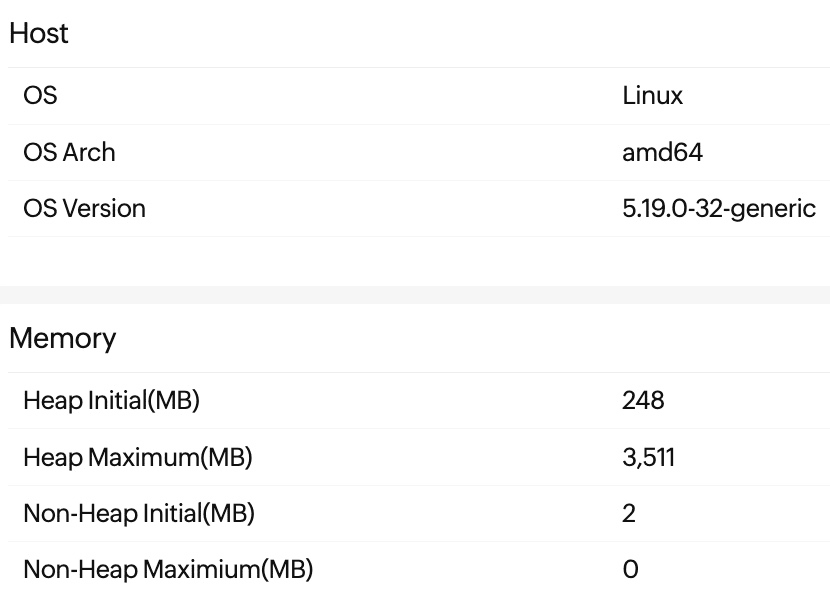
Host
| Parameter | Description |
|---|---|
| OS | The OS running on the host machine where the JVM is deployed |
| OS Arch | The architecture of the OS, indicating whether it is 32-bit or 64-bit |
| OS Version | The version of the OS running on the host machine |
Memory
| Parameter | Description |
|---|---|
| Heap Initial(MB) | The initial amount of memory allocated for the JVM heap space |
| Heap Maximum(MB) | The maximum amount of memory that can be allocated for the JVM heap space |
| Non-Heap Initial(MB) | The initial amount of memory allocated for the JVM non-heap space |
| Non-Heap Maximum(MB) | The maximum amount of memory that can be allocated for the JVM non-heap space |
You can also configure alerts for the JVM metrics.
-
On this page
- Summary
- Garbage Collector
- Threads
- Memory Leak Detection
- Configuration