Start monitoring your Google Cloud Platform resources
Site24x7 monitors the health and performance of your Google Cloud Platform (GCP) resources by using Site24x7's Cloud APIs. The data collected every five minutes is matched against the safe limits set in your threshold profile. If there is any breach, an alert is triggered; and if it is required, auto-remediation can perform basic healing actions.
Steps to start monitoring Google Cloud Resources with Site24x7
Create a service account in Google Cloud console
Sign in to your Google Cloud console to create a service account. A service account enables metrics collection on behalf of Site24x7. In this help document, you can learn about the prerequisites and instructions to create a service account.
Assign permissions to the service account
Minimal permissions are required to monitor the resource performance.
| Scope | Permissions required |
| For monitoring performance metrics |
|
For management actions (like starting or stopping VMs) |
|
Export JSON key
The JSON key contains the authentication credentials for the service account.
- In the Google Cloud console, navigate to IAM & Admin > Service Accounts.
- Open the service account for which you would like to create the key.
- Under the Keys tab, click Add key > Create New Key.
- Select JSON as the key type and click Create.
Customizing your GCP monitor
- In the Filter Resources section:
- Service/Resource Types: Select the Google Cloud resource types you would like to monitor.
- Metric Profile: Select an existing metric profile from the drop-down menu, or create a new profile using the + icon next to this field to select only the metrics for which you would like Site24x7 to make API calls and collect.
- Exclude/Include Resources using Labels/Tags: Enter the tags you have used in Google Cloud so that only the resources with those tags will be included or excluded for monitoring.
- Auto-discover New Resources: Enable this field to automatically discover and monitor any new resource created in the Google Cloud console.
- Discovery Interval: Set the frequency at which resource auto-discovery should happen.
- Auto-create monitor groups:
- Yes: A monitor group will be created with the name of the project, and all resources in the project will be listed under the monitor group.
- No: A monitor group will not be created.
- Display Server Monitor After Integration:
- Yes: The VM's performance and health metrics will be listed in both the Servers tab and also on the Google Cloud VM's monitor page.
- No: The VM's performance and health metrics will be listed only on the Google Cloud VM's monitor page.
- Sync Display Name from Agent Configuration:
- Yes: The server monitor name will be synchronized with the resource name.
- No: The server monitor name will be synchronized with the VM's hostname.
- In the Resource Termination Settings section:
- Mute Resource Termination Alerts:
- Yes: Mutes all the alerts triggered when a Google Cloud resource is terminated.
- No: Alerts will be triggered when a Google Cloud resource is terminated.
- Monitor Terminated Resources:
- Yes: When a resource is terminated in the Google Cloud portal, monitoring will continue, but the monitor's status will be displayed as down.
- No: Automatically removes the resources terminated in the Google Cloud portal from monitoring.
- Automatically Remove Terminated Resources:
- Yes: If a resource is terminated in the Google Cloud portal, the respective monitor will be removed after a preset time limit. You can set the time limit in the Remove Terminated Resources After field, and it will be enabled only after setting Yes.
- No: Moves the respective monitors for the resources terminated in the Google Cloud portal to a suspended state, and then they will be deleted. Suspended monitors do not consume monitoring licenses.
- Mute Resource Termination Alerts:
- In the Guidance Report Configuration section:
- Enable all Best Practice Checks and Use Default Baselines
Site24x7's Guidance Report analyzes your GCP account using our best practice recommendation checks and provides insights to reduce costs and improve performance. If you want to enable all checks and use default baselines, keep the toggle at Yes. If you're going to choose the recommendations and configure custom baselines (only applicable for the following checks: VM Instances - Underutilization and VM Instances - Highutilization) toggle the option to No. -
How can I create a new baseline for the VM Instances check?
-
Toggle the Enable all Best Practice Checks and Use Default Baselines option to No. The page should refresh, and a new section listing all the guidance report checks should appear.
- Select VM Instances - Underutilization and VM Instances - Highutilization checks and configure new values for the metrics CPU Usage, Network In, and Network Out.
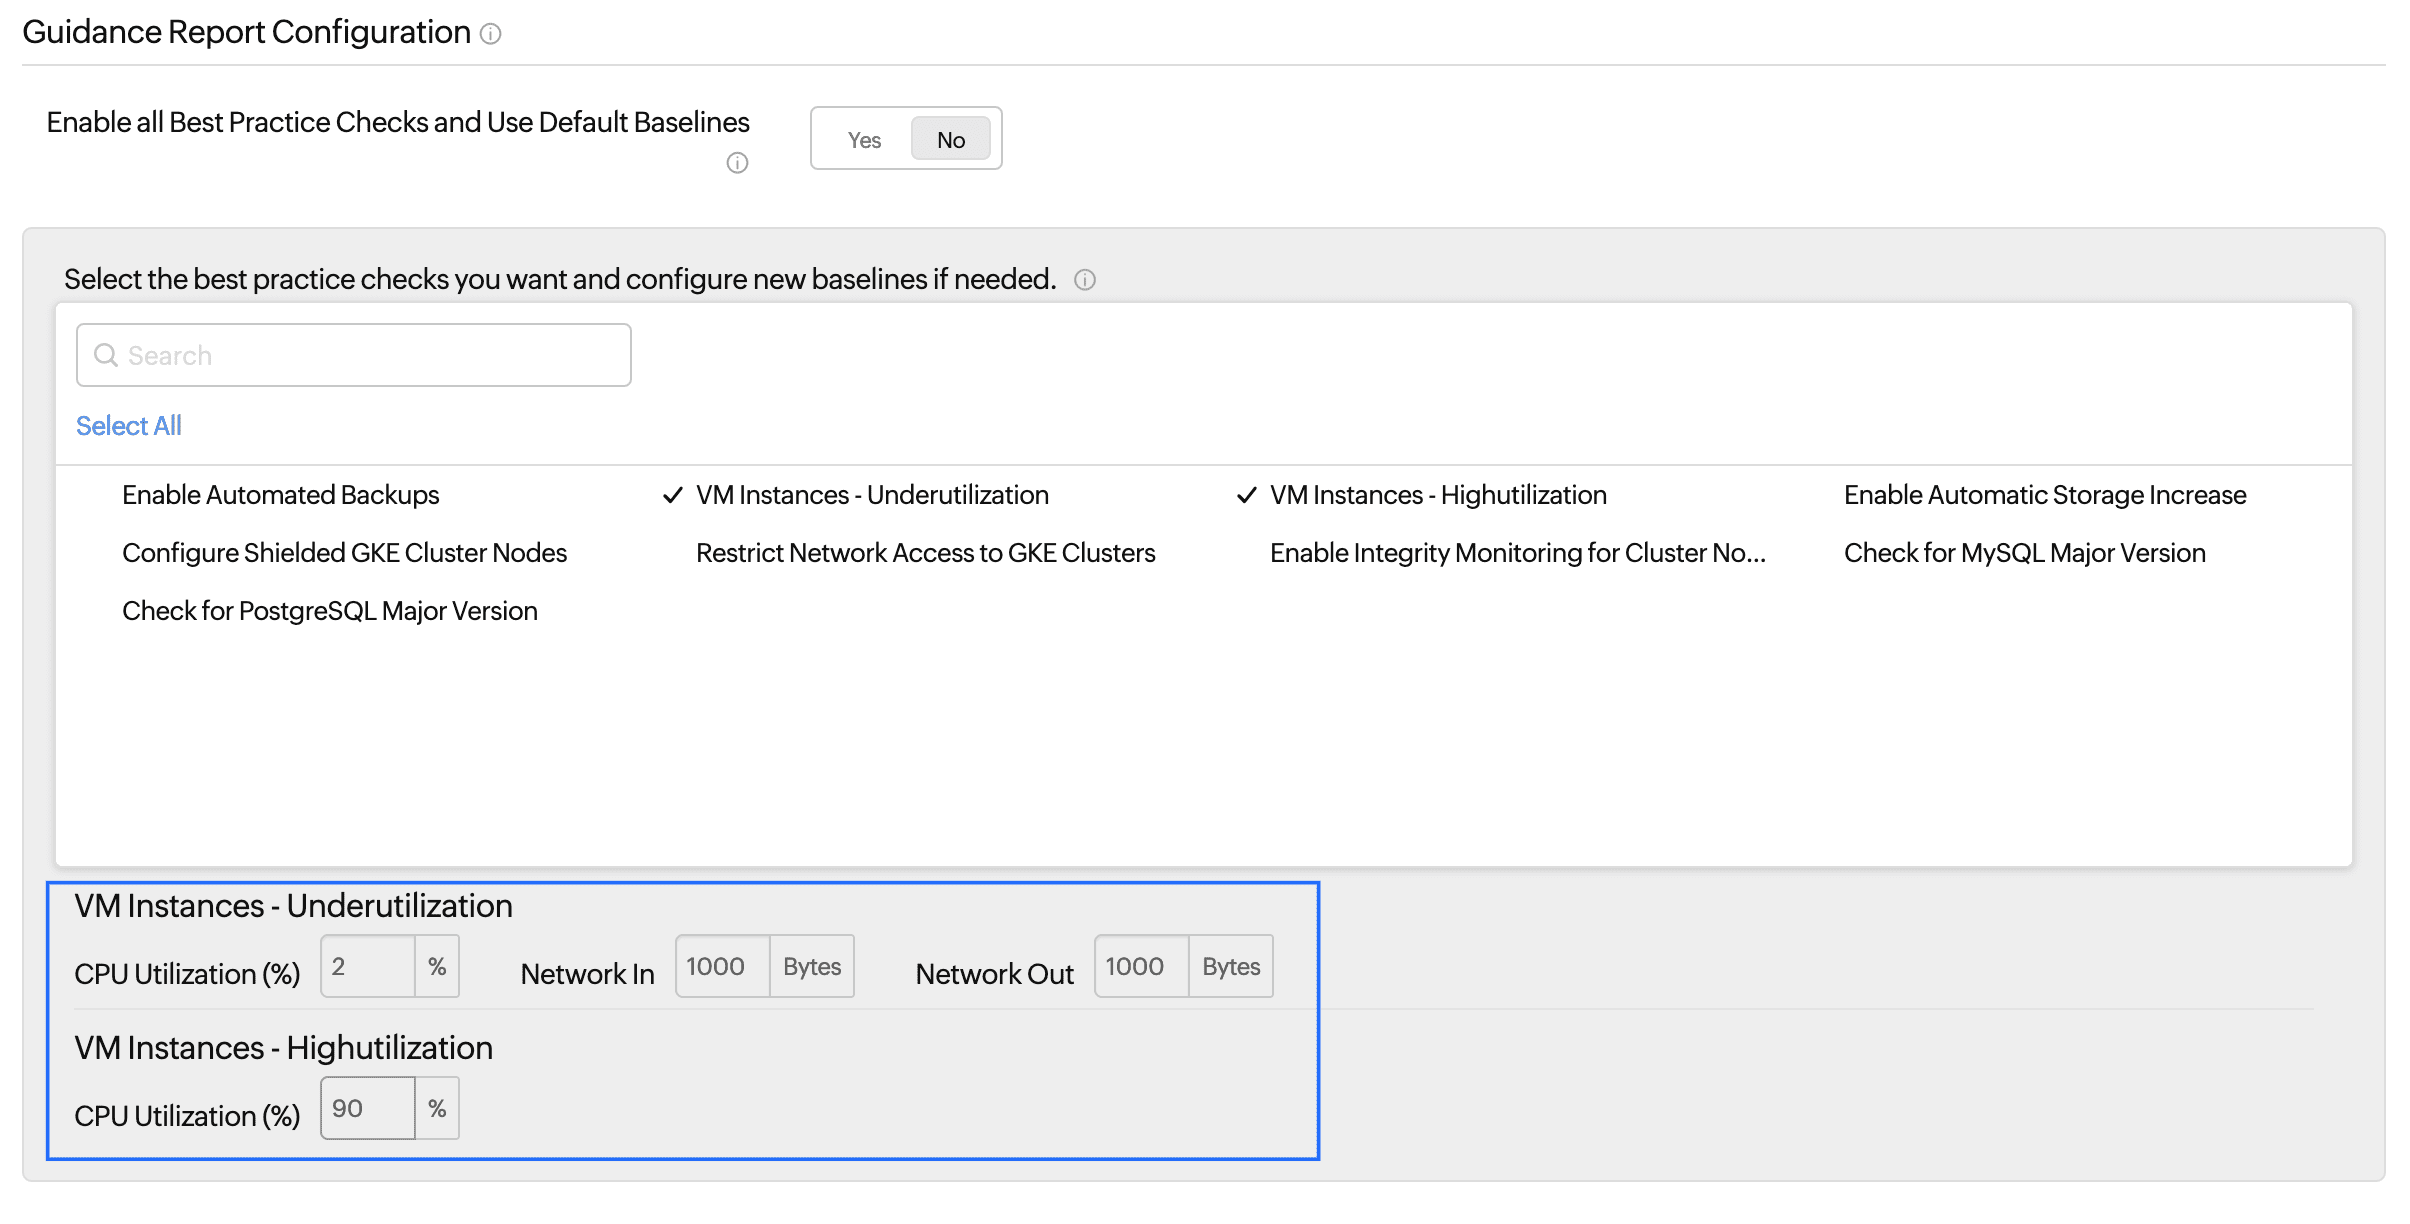
- Click Save.
-
- Enable all Best Practice Checks and Use Default Baselines
- In the Auto-assign Threshold Profile section:
- Go to Cloud > GCP and click the GCP monitor. Click any of the service types listed in the left panel, then select the desired resource monitor.
- Hover over the hamburger icon
 beside the display name, then click Edit.
 - In the Edit GCP Resource Monitor page navigate to Advanced Configuration> Auto-assign Threshold Profile:
- Overwrite Existing Settings: Toggle Yes to overwrite the existing threshold profile settings.
- Configure a Default Threshold Profile for every service supported: Select the threshold profile which you want to overwrite.
- You can also create new threshold profiles by clicking the + icon.
- In the Configuration Profiles section:
- Associate with Monitor Group(s): Select the monitor groups you would like to associate with the monitor you are creating. Use the + icon to create a new monitor group.
- Dependent on Monitor: Select the monitor on which the monitor you are creating is dependent on. Here's an example to understand better: If a Google Cloud project monitor is dependent on an organization monitor, when the organization monitor is down, only one alert will be triggered for the organization monitor. The redundant project monitor alert will not be triggered. This is to reduce alert fatigue.
- Tags: Select the tags you would like to associate with the monitor you are creating. Click the Add Tag button to create a new tag.
- IT Automation Templates: Set auto-remediation actions via an IT Automation template to run during outages and performance degradation scenarios in the Select Automation drop-down menu, and also set conditions on when to execute them in the next field.
- Execute IT Automation during Scheduled Maintenance: Check this box to run auto-remediation IT Automation actions, even during scheduled maintenance time frames.
- In the Alert Settings section:
- User Alert Group: Select the user alert group to which you would like to send notifications related to the monitor you are creating.
- On-Call Schedule: Select an On-Call Schedule so that the alerts reach the appropriate person at the appropriate time.
- Notification Profile: Select the required Notification Profile to set how notifications should be sent. Use the + icon to create a new Notification Profile.
- Click Start GCP Monitoring.
How Site24x7 monitors your Google Cloud resources
Site24x7 sends one or more requests to the Cloud API of each resource and derives data for each minute. Data collection happens every five minutes. Site24x7 analyzes the data and presents it in user-desired reports or dashboard formats. If the user has set thresholds, Site24x7 checks whether the derived data corresponds to the configured threshold limit. If there is any breach, an alert will be triggered in mediums like email, IM applications like Microsoft Teams, and many more.
Site24x7's GCP monitoring is done by fetching the access keys in the service account JSON file uploaded by the user in the Site24x7 web client. The private keys in the JSON file are stored in an encrypted format. Performance metrics for GCP monitoring are collected using the GCP Monitor REST API. Learn the permissions that you need to enable GCP monitoring.

Features of GCP Monitoring
To learn more about the salient features of Site24x7's GCP monitoring platform, refer to the following links:
- Service View - Dashboard listing down all active GCP resource types
- Infrastructure dashboard - The NOC view of all your GCP monitors
- Inventory dashboard - Crisp inventory of all your active resources in Google Cloud Platform
- Management actions - The console from where you can manage GCP resources from Site24x7 console
- Guidance report - Industry's best practices to improve your GCP setup
Learn more about Google Cloud monitoring in our dedicated help document for Google Cloud monitoring features.