Azure SQL Database Monitoring Integration
Azure SQL Database is a fully managed platform as a service database engine that takes care of most database maintenance tasks like upgrades, patches, backups, and monitoring without the need for human intervention. It can process both relational data and non-relational structures like graphs, JSON, spatial, and XML.
With Site24x7's integration, you can now monitor your database metrics, configure thresholds, and receive instant alerts.
Setup and configuration
Adding an Azure SQL Database while configuring a new Azure monitor
If you haven't configured an Azure Monitor yet, add one by following the steps below:
- Log in to your Site24x7 account.
- Choose Cloud from the left navigation pane, and select Azure > Add Azure Monitor. You can also follow these steps to add an Azure Monitor.
- During Azure monitor configuration, in the Edit Azure Monitor page, select Azure SQL Database from the Service/Resource Types drop-down.
Adding an Azure SQL Database to an existing Azure monitor
If you already have an Azure monitor configured for the tenant, you can add the Azure network interface by using the following steps:
- Log in to your Site24x7 account.
- Navigate to the Infrastructure, Inventory, or Management Dashboard from the left pane of the Azure monitor for which you wish to add an Azure SQL database.
- Click the hamburger icon
 and then Edit, which will bring you to the Edit Azure Monitor page.
 - In the Edit Azure monitor page, select the corresponding Subscription and Resource Group from the drop-down menu, select Azure SQL Database from the Service/Resource Types drop-down, and click Save.
After successful configuration, go to Cloud > Azure, select Azure SQL Database from the Azure monitor drop-down. Now you can view the discovered SQL databases.
It will take 15-30 minutes to discover new Azure resources. For immediate discovery of the selected configuration, go to the Infrastructure Dashboard of the Azure monitor and click on Discover Now from the ![]() icon.
icon.
Polling frequency
Site24x7's Azure SQL Database Monitor collects metric data every minute and the statuses from your SQL databases every five minutes.
Supported metrics
The following metrics are collected:
| Metric name | Description | Statistic | Unit |
|---|---|---|---|
| Database Availability | The percentage of SLA compliant availability for the database | Average | Percent |
| Blocked by Firewall | The number of SQL connections blocked by the firewall | Average | Count |
| Failed Connections | The number of failed connections | Average | Count |
| Successful Connections | The number of successful connections | Average | Count |
| CPU percentage | The percentage of CPU consumed by SQL processing | Average | Percent |
| Deadlocks | The number of deadlocks | Average | Count |
| DTU percentage | The percentage of total database transaction units (DTUs) used | Average | Percent |
| DTU Limit | The limit of processed DTUs | Average | Count |
| DTU used | The number of DTUs used | Average | Count |
| Log IO percentage | The percentage of log input and output (IO) | Average | Percent |
| Data IO percentage | The percentage of IO data | Average | Percent |
| Sessions percentage | The percentage of maximum concurrent sessions of the database’s service | Average | Percent |
| Data space used | The amount of space used to store database data | Average | Bytes |
| Data space used percent | The percentage of space used to store database data | Average | Percent |
| Workers percentage | The percentage of maximum concurrent workers (requests) of the database | Average | Percent |
| In-Memory OLTP storage percent | The percentage of In-memory Online Transaction Processing(OLTP) storage | Average | Percent |
| SQL Instance CPU | The percentage of CPU used by all user and system workloads. This is not applicable to data warehouses. | Average | Percent |
| SQL Instance Memory | The percentage of memory used by the database engine instance. This is not applicable to data warehouses. | Average | Percent |
| Data Backup Storage Size | The storage size of the cumulative data backup. This applies to hyperscale databases. | Average | Bytes |
| Data Storage Size | The storage size of the data. This applies to hyperscale databases. | Average | Bytes |
Azure Uptime monitoring
Site24x7’s Azure Uptime monitoring enables proactive tracking of your Azure resources’ availability and uptime, along with their configuration and inventory details. Note that uptime monitoring will disable performance metric data collection.
Threshold configuration
Global configuration
- Go to the Admin section in the left navigation pane.
- Select Configuration Profiles from the left pane and choose the Threshold and Availability (+) tab from the drop-down menu.
- Choose Azure SQL Database as the monitor type. Now you can set the threshold values for all the metrics mentioned above.
Monitor-level configuration
- Go to Cloud > Azure and select Azure SQL Database from the drop-down menu.
- Choose a resource for which you would like to set a threshold and then click the hamburger icon
 near the resource name. Choose the Edit option, which will direct you to the Edit Azure SQL Database Monitor page.
You can set the threshold values for the metrics by selecting the Threshold and Availability option. You can also configure IT Automation at the attribute level.
IT Automation
Site24x7's IT Automation tools help auto-resolve performance degradation issues. The alarm engine continually evaluates the system events for which thresholds are set and executes the mapped automation when there is a breach.
How to configure IT Automation for a monitor.
Configuration Rules
Configure parameters like Threshold Profile, Notification Profile, Tags, Monitor Group, and others for multiple monitors with Site24x7's Configuration Rules. You can run a scan and associate any of the previously generated rules that suit the monitor configurations while adding new monitors.
How to add a configuration rule.
Summary
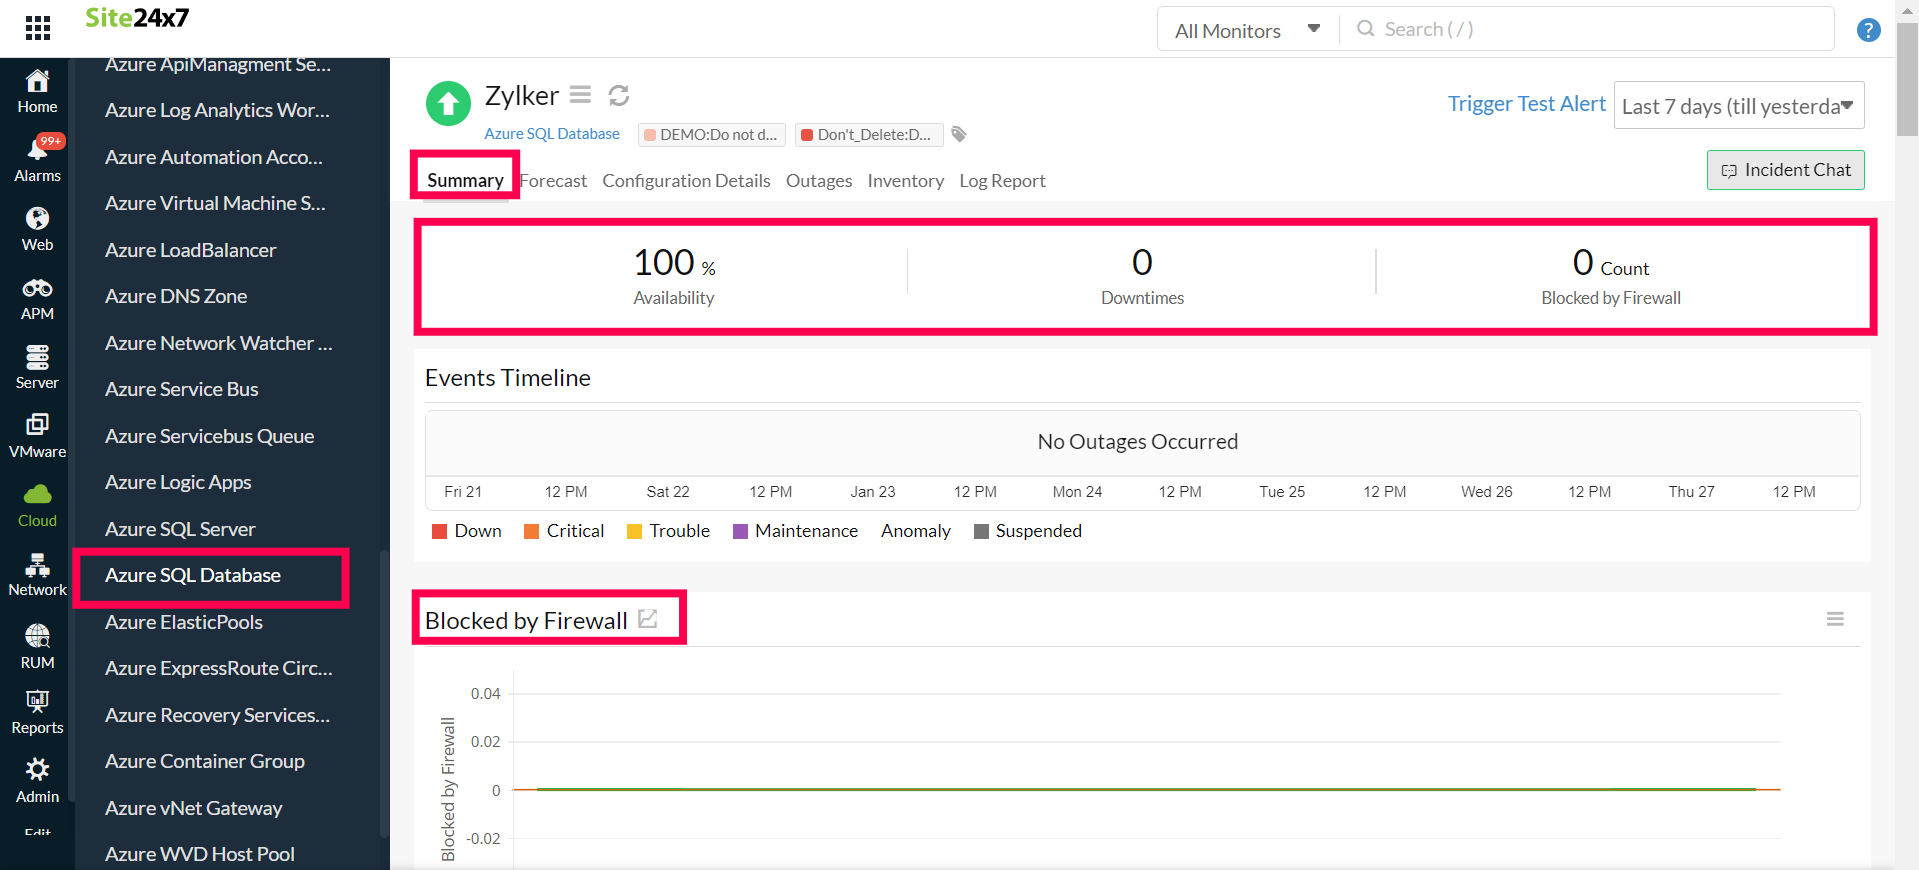
The Summary tab will give you the performance data organized by time for the above mentioned metrics.
- To view the summary, go to Cloud > Azure and click the Azure monitor > Azure SQL Database.
- Click a resource and select the Summary tab.
Doing this allows you to view the Failed Connections, Successful Connections, DTU Limit, DTU Percentage, and much more.
Configuration Details
The Configuration Details of the SQL Database are provided under this tab. Here, you'll find the Pricing Tier, Maximum Storage Size, Database Status, and so on.
- To get the configuration details, go to Cloud > Azure and click the Azure monitor > Azure SQL Database.
- Click a resource and select the Configuration Details tab.
Forecast
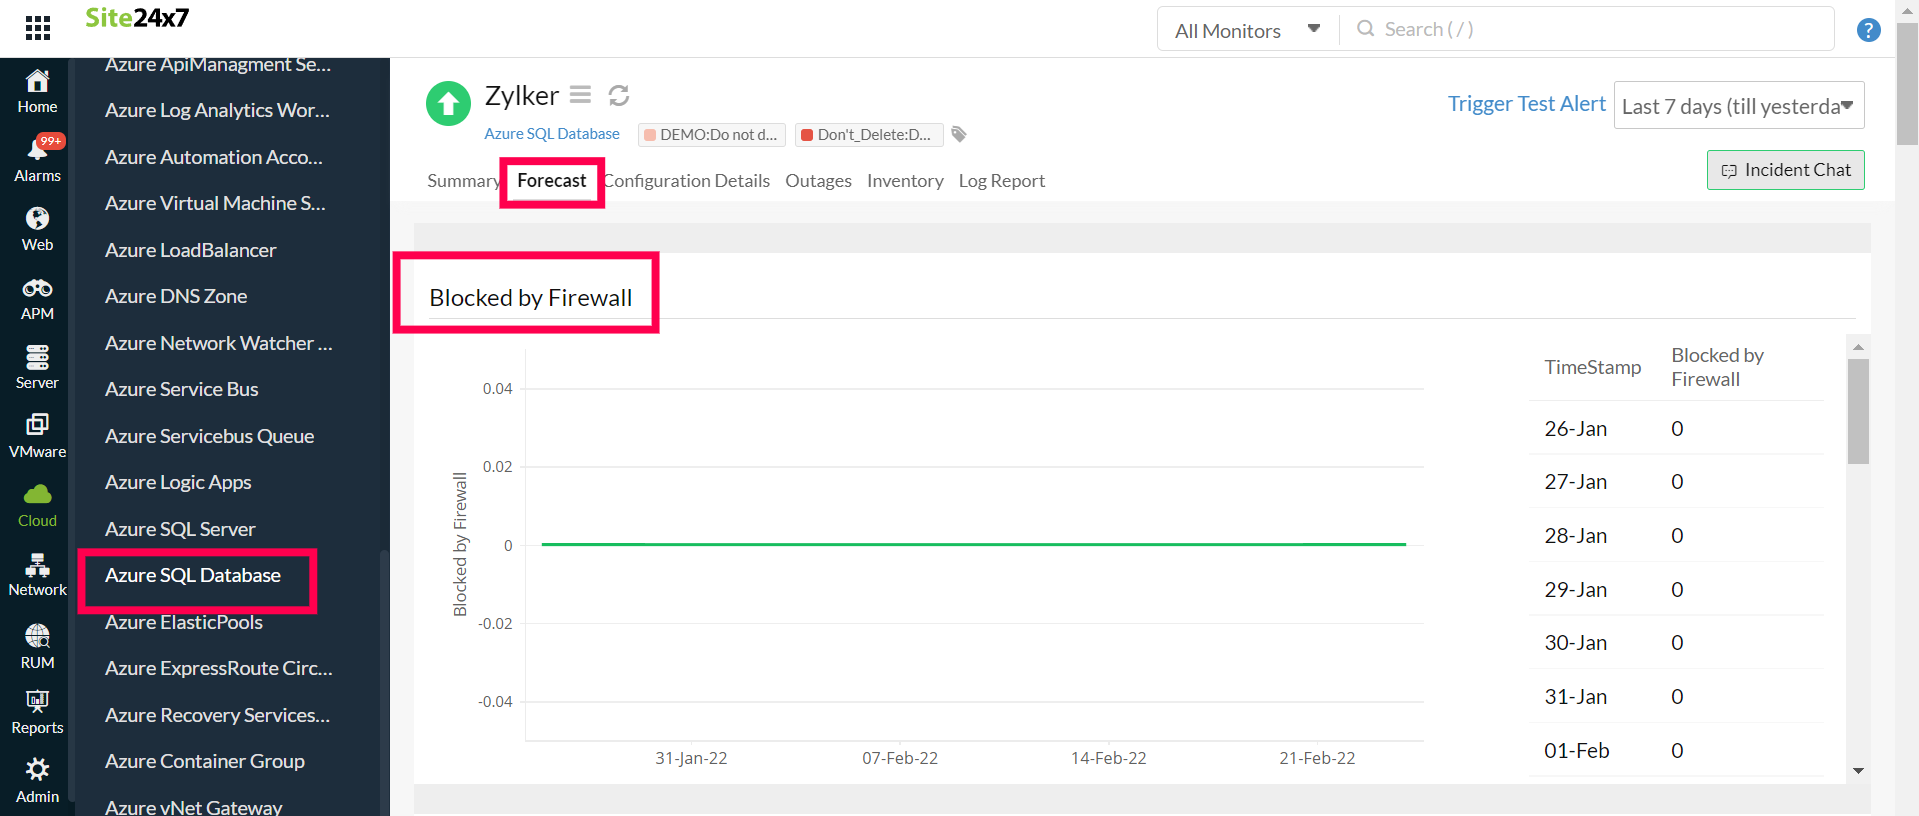
Site24x7's forecasting engine enables you to predict the future points of Azure SQL Database performance metrics based on historical observations. To predict your metric value for the next seven days, it requires about 15-30 days of historical data.
- You can view forecast charts by navigating to the Cloud section in the left navigation pane.
- Select Azure SQL Database from the Azure drop-down, click a resource, and then choose the Forecast tab.

Reports
Gain in-depth data about the various parameters of your monitored resources and highlight your service performance using our insightful reports.
To view reports for Azure SQL Database:
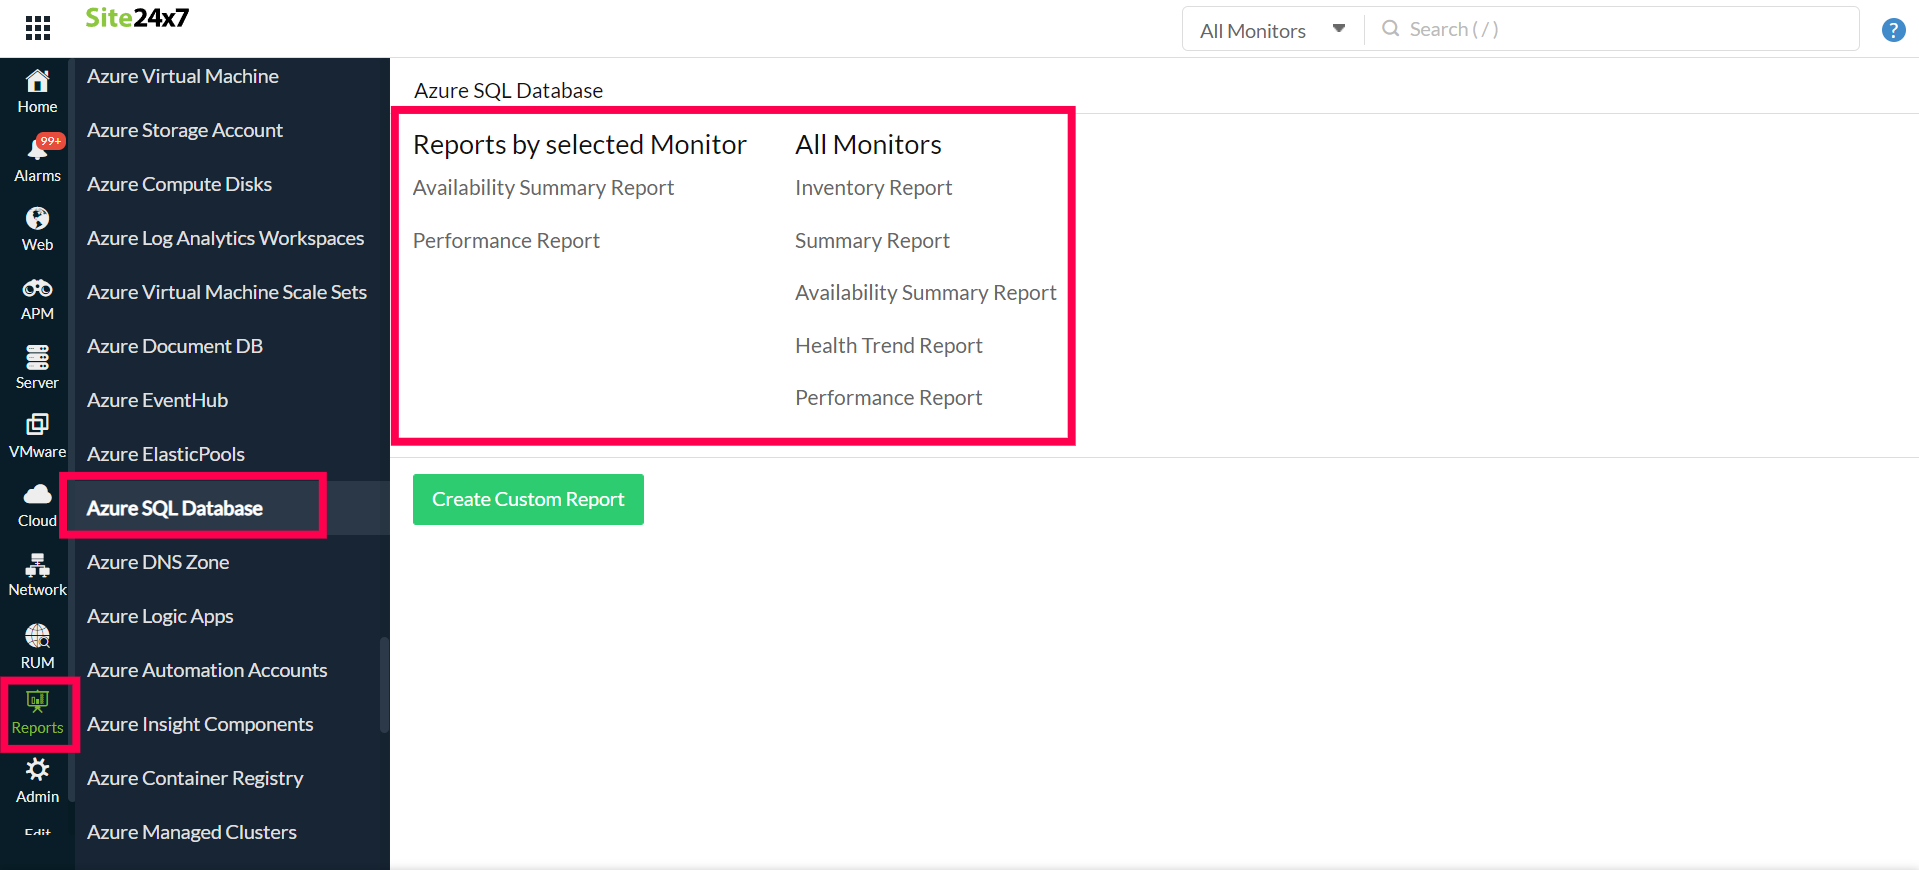
- Navigate to the Reports section on the left navigation pane.
- Select Azure SQL Database from the menu on the left.
You can find the Availability Summary Report and the Performance Report for one selected monitor, or you can get the Inventory Report, Summary Report, Availability Summary Report, Health Trend Report, and the Performance Report for all the SQL Database monitors.

You can also get reports from the Summary tab of the Azure SQL Database Monitor.
- Go to the Summary tab of the Azure SQL Database Monitor, and get the Availability Summary Report of the monitor by clicking on Availability or Downtime.
- You can also find the Performance Report of the monitor by clicking on any chart title.

Related links:
How to add an Azure monitor.
How to configure IT automations for a monitor.
How to integrate an Azure App Service monitor.
How to integrate Azure Virtual Machine monitor.
How to configure IT automations for a monitor.
View the list of monitor reports.
