Autonomous Database monitoring
Oracle Autonomous Database is a cloud-based, self-managing database service offered by Oracle Cloud Infrastructure (OCI). It automates key database management tasks, such as tuning, patching, updating, backups, and security, using artificial intelligence and machine learning.
Overview
Oracle Autonomous Database monitoring refers to the process of continuously tracking and analyzing the performance, availability, and resource usage of an Autonomous Database. Site24x7’s Oracle Autonomous Database monitoring involves real-time observation of key metrics such as CPU usage, storage utilization, query response times, and database connections.
Use case
Let's say an organization using Oracle Autonomous Databases for its enterprise applications wants to ensure high availability and optimal performance. By integrating its Autonomous Databases with Site24x7, the organization can monitor various key metrics such as resource utilization, database availability, and query performance.
For instance, if a performance bottleneck is detected during peak traffic hours, Site24x7 alerts the administrators in real time. They can then analyze the detailed reports and make necessary optimizations before any major performance degradation impacts the application.
Benefits of Site24x7's Autonomous Database integration
Integrate your Autonomous Database with Site24x7 to:
- Gain complete visibility into the performance of Autonomous Databases across your OCI infrastructure.
- Receive instant alerts on threshold breaches, enabling quick response to potential problems.
- Identify operational bottlenecks and optimize your database workloads.
- Schedule IT automation to start, restart, or stop a database at any time.
Setup and configuration
- Site24x7 uses cross-tenancy access to monitor your resources using Site24x7's tenancy user. Log in to your Site24x7 account and create a specific policy to allow Site24x7 to view your resources without affecting your security.
- On the Add OCI Monitor page, select Autonomous Database from the Services to be discovered list.
Permissions
Ensure that Site24x7 receives the following permissions to monitor the Autonomous Database:
- listAutonomousDatabases - AUTONOMOUS_DATABASE_INSPECT
- GetAutonomousDatabase - AUTONOMOUS_DATABASE_INSPECT
- listAutonomousDatabaseBackups - AUTONOMOUS_DB_BACKUP_INSPECT
Polling frequency
Site24x7 queries OCI service-level APIs according to the set polling frequency (from once a minute to once a day) to collect metrics from an Autonomous Database monitor.
Supported metrics
The supported metrics for an Autonomous Database monitor are provided below.
Supported metrics for Dedicated Exadata Infrastructure Type
| Metric name | Description | Statistic | Unit |
|---|---|---|---|
| Apply Lag | How far the standby database is behind the primary database as of the time sampled (in seconds). | Sum | Seconds |
| DB Block Changes | The average number of blocks changed per second. | Sum | Count per second |
| ECPU Allocated | The actual number of Elastic Compute Processing Units (ECPUs) allocated by the service during the selected interval of time. | Sum | Count |
| IOPS | The average number of I/O operations per second. | Sum | Count per second |
| IO Throughput | The average throughput in MB per second. | Sum | MB per second |
| Logical Reads | The average number of logical block reads ("db block gets" plus "consistent gets") per second. Includes buffered and direct I/O. Interval: 1 minute | Sum | Count per second |
| OCPU Allocated | The actual number of Oracle CPUs (OCPUs) allocated by the service during the selected interval of time. | Sum | Count |
| Parses By Type | The number of hard or soft parses per second. | Sum | Count per second |
| Redo Generated | The average amount of redo generated in MB per second. | Sum | MB per second |
| Allocated Storage Space By Tablespace | The maximum amount of space allocated for each tablespace during the interval. | Maximum | GB |
| Storage Space Used By Tablespace | The maximum amount of space used by each tablespace during the interval. | Maximum | GB |
| Storage Space Utilization By Tablespace | The percentage of space utilized by each tablespace. | Average | Percentage |
| Transactions By Status | The number of committed or rolled back transactions per second. | Sum | Count per second |
| Transport Lag | The approximate number of seconds of redo which is not yet available on the standby database as of the time sampled. | Sum | Seconds |
Supported metrics for Serverless
| Metric name | Description | Statistic | Unit |
|---|---|---|---|
| Connection Latency | The time taken to connect to an Oracle Autonomous Database Serverless instance in each region from a Compute service virtual machine in the same region. Interval: 5 minutes | Maximum | Milliseconds |
| Database Availability | The database is available for connections in the given minute, with possible values: 1 = DB Available 0 = DB Unavailable Interval: One minute | Average | Count |
| Failed Connections | The number of failed database connections. Interval: One minute | Sum | Count |
| Failed Logons | The number of logons that failed because of an invalid username and/or password during the selected interval. Interval: One minute | Average | Count |
| Parse Count (Hard) | The number of parse calls (real parses) during the selected time interval. A hard parse is an expensive operation in terms of memory use, because it requires Oracle to allocate a workheap and other memory structures and then build a parse tree. Interval: One minute | Sum | Count |
| Logical Reads | The sum of "db block gets" plus "consistent gets" during the selected time interval. This includes logical reads of database blocks from either the buffer cache or process private memory. | Sum | Count |
| Failed Parse Count | The number of parse failures during the selected time interval. Interval: One minute | Sum | Count |
| Physical Reads | The number of data blocks read from the disk during the selected time interval. Interval: One minute | Sum | Count |
| Physical Read Total Bytes | The size of disk reads (in bytes) by all database instance activities, including application reads, backup and recovery, and other utilities, during the selected time interval. Interval: One minute | Sum | Count |
| Physical Writes | The number of data blocks written to disk during the selected time interval. Interval: One minute | Sum | Count |
| Physical Write Total Bytes | The size of all disk writes (in bytes) for database instances, including application activity, backup and recovery, and other utilities, during the selected time interval. Interval: One minute | Sum | Count |
| Query Latency | The time taken to display the results of a simple query on the user's screen. Interval: Five minutes | Maximum | Milliseconds |
| Queued Statements | The number of queued SQL statements aggregated across all consumer groups during the selected interval. Interval: One minute | Sum | Count |
| Redo Generated | Amount of redo generated in bytes during the selected time interval. Interval: One minute | Sum | Count |
| Running Statements | The number of running SQL statements aggregated across all consumer groups during the selected interval. Interval: One minute | Average | Count |
| Sessions | The number of sessions in the database. Interval: One minute | Sum | Count |
| Bytes Received via SQL*Net from Client | The number of bytes received from the client over Oracle Net Services during the selected time interval. Interval: One minute | Sum | Count |
| Bytes Received via SQL*Net from DBLink | The number of bytes received from a database link over Oracle Net Services during the selected time interval. Interval: One minute | Sum | Count |
| Bytes Sent via SQL*Net to Client | The number of bytes sent to the client from the foreground processes during the selected time interval. Interval: One minute | Sum | Count |
| Bytes Sent via SQL*Net to DBLink | The number of bytes sent over a database link during the selected time interval. Interval: One minute | Sum | Count |
| User Commits | The number of user commits during the selected time interval. When a user commits a transaction, the generated redo that reflects the changes made to database blocks must be written to the disk. Commits often represent the closest thing to a user transaction rate. Interval: One minute | Sum | Count |
| User Rollbacks | The number of times users manually issue the ROLLBACK statement or an error occurs during a user's transactions during the selected time interval. Interval: One minute | Sum | Count |
| Active APEX Applications | The number of active APEX applications. | Sum | Count |
| APEX Page Events | The number of APEX page events. | Sum | Count |
| APEX Page Load Time | The APEX page load time. | Average | Seconds |
| APEX Workspace Count | The number of APEX workspace. | Sum | Count |
Supported metrics for Dedicated Exadata Infrastructure Type and Serverless
| Metric name | Description | Statistic | Unit |
|---|---|---|---|
| CPU Time | The average rate of accumulation of CPU time by foreground sessions in the database over the time interval. Interval: One minute | Average | Seconds |
| CPU Utilization | The CPU usage expressed as a percentage, aggregated across all consumer groups. The utilization percentage is reported with respect to the number of CPUs the database is allowed to use. Interval: One minute | Average | Percentage |
| User Calls | The combined number of logons, parses, and execute calls during the selected interval. Interval: One minute | Sum | Count |
| Storage Space Allocated | The amount of space allocated to the database for all tablespaces during the interval. Interval: One hour | Maximum | GB |
| Maximum Storage Space | The maximum amount of storage reserved for the database during the interval. Interval: One hour | Maximum | GB |
| Storage Space Used | The maximum amount of space used during the interval. Interval: One hour | Maximum | GB |
| Storage Utilization | The percentage of the reserved maximum storage currently allocated for all database tablespaces. This represents the total reserved space for all tablespaces. Interval: One hour | Average | Percentage |
| Transaction Count | The combined number of user commits and user rollbacks during the selected interval. Interval: One minute | Sum | Count |
| Current Logons | The number of successful logons during the selected interval. Interval: One minute | Sum | Count |
| Parse Count (Total) | The number of hard and soft parses during the selected interval. Interval: One minute | Sum | Count |
| DB Block Changes | The number of changes that were part of an update or delete operation that were made to all blocks in the System Global Area . Such changes generate redo log entries and thus become permanent changes to the database if the transaction is committed. This approximates total database work. This statistic indicates the rate at which buffers are being dirtied during the selected time interval. Interval: One minute | Sum | Count |
| DB Time | The amount of time database user sessions spend executing database code (CPU Time + WaitTime). DB Time is used to infer database call latency, because DB Time increases in direct proportion to both database call latency (response time) and call volume. It is calculated as the average rate of accumulation of database time by foreground sessions in the database over the time interval. Interval: One minute | Average | Seconds |
| Execute Count | The number of user and recursive calls that executed SQL statements during the selected interval. Interval: One minute | Sum | Count |
| Wait Time | The average rate of accumulation of non-idle wait time by foreground sessions in the database over the time interval. Interval: One minute | Average | Seconds |
| Active Backup | The number of backups in active state. | Sum | Count |
| Deleted Backup | The number of backups in deleted state. | Sum | Count |
| Failed Backup | The number of backups in failed status. | Sum | Count |
| Incremental Backup | The number of backups in the incremental type. | Sum | Count |
| Full Backup | The number of backups in the full backup type. | Sum | Count |
| Long-term Backup | The number of backups in the long-term type. | Sum | Count |
Threshold configuration
To configure thresholds for an Autonomous Database monitor:
- Log in to your Site24x7 account and navigate to Admin > Configuration Profiles > Threshold and Availability.
- Click Add Threshold Profile.
- Select Autonomous Database from the Monitor Type drop-down menu and provide an appropriate name in the Display Name field.
- The supported metrics are displayed in the Threshold Configuration section. You can set threshold values for all the metrics mentioned above.
- Click Save.
Forecast
Estimate future values of the CPU Utilization, CPU Time, and Storage Utilization metrics with the Forecast feature. Predict future points of these performance metrics (measurement of resource usage) based on historical observations and make informed decisions.
IT automation
You can add automations to start, stop, or restart Autonomous Databases. Go to Admin > IT Automation Templates (+) > Add Automation Templates. Once automations are added, you can schedule them to be executed one after the other.
Licensing
Each Autonomous Database monitor utilizes one basic monitor license.
Viewing Autonomous Database data
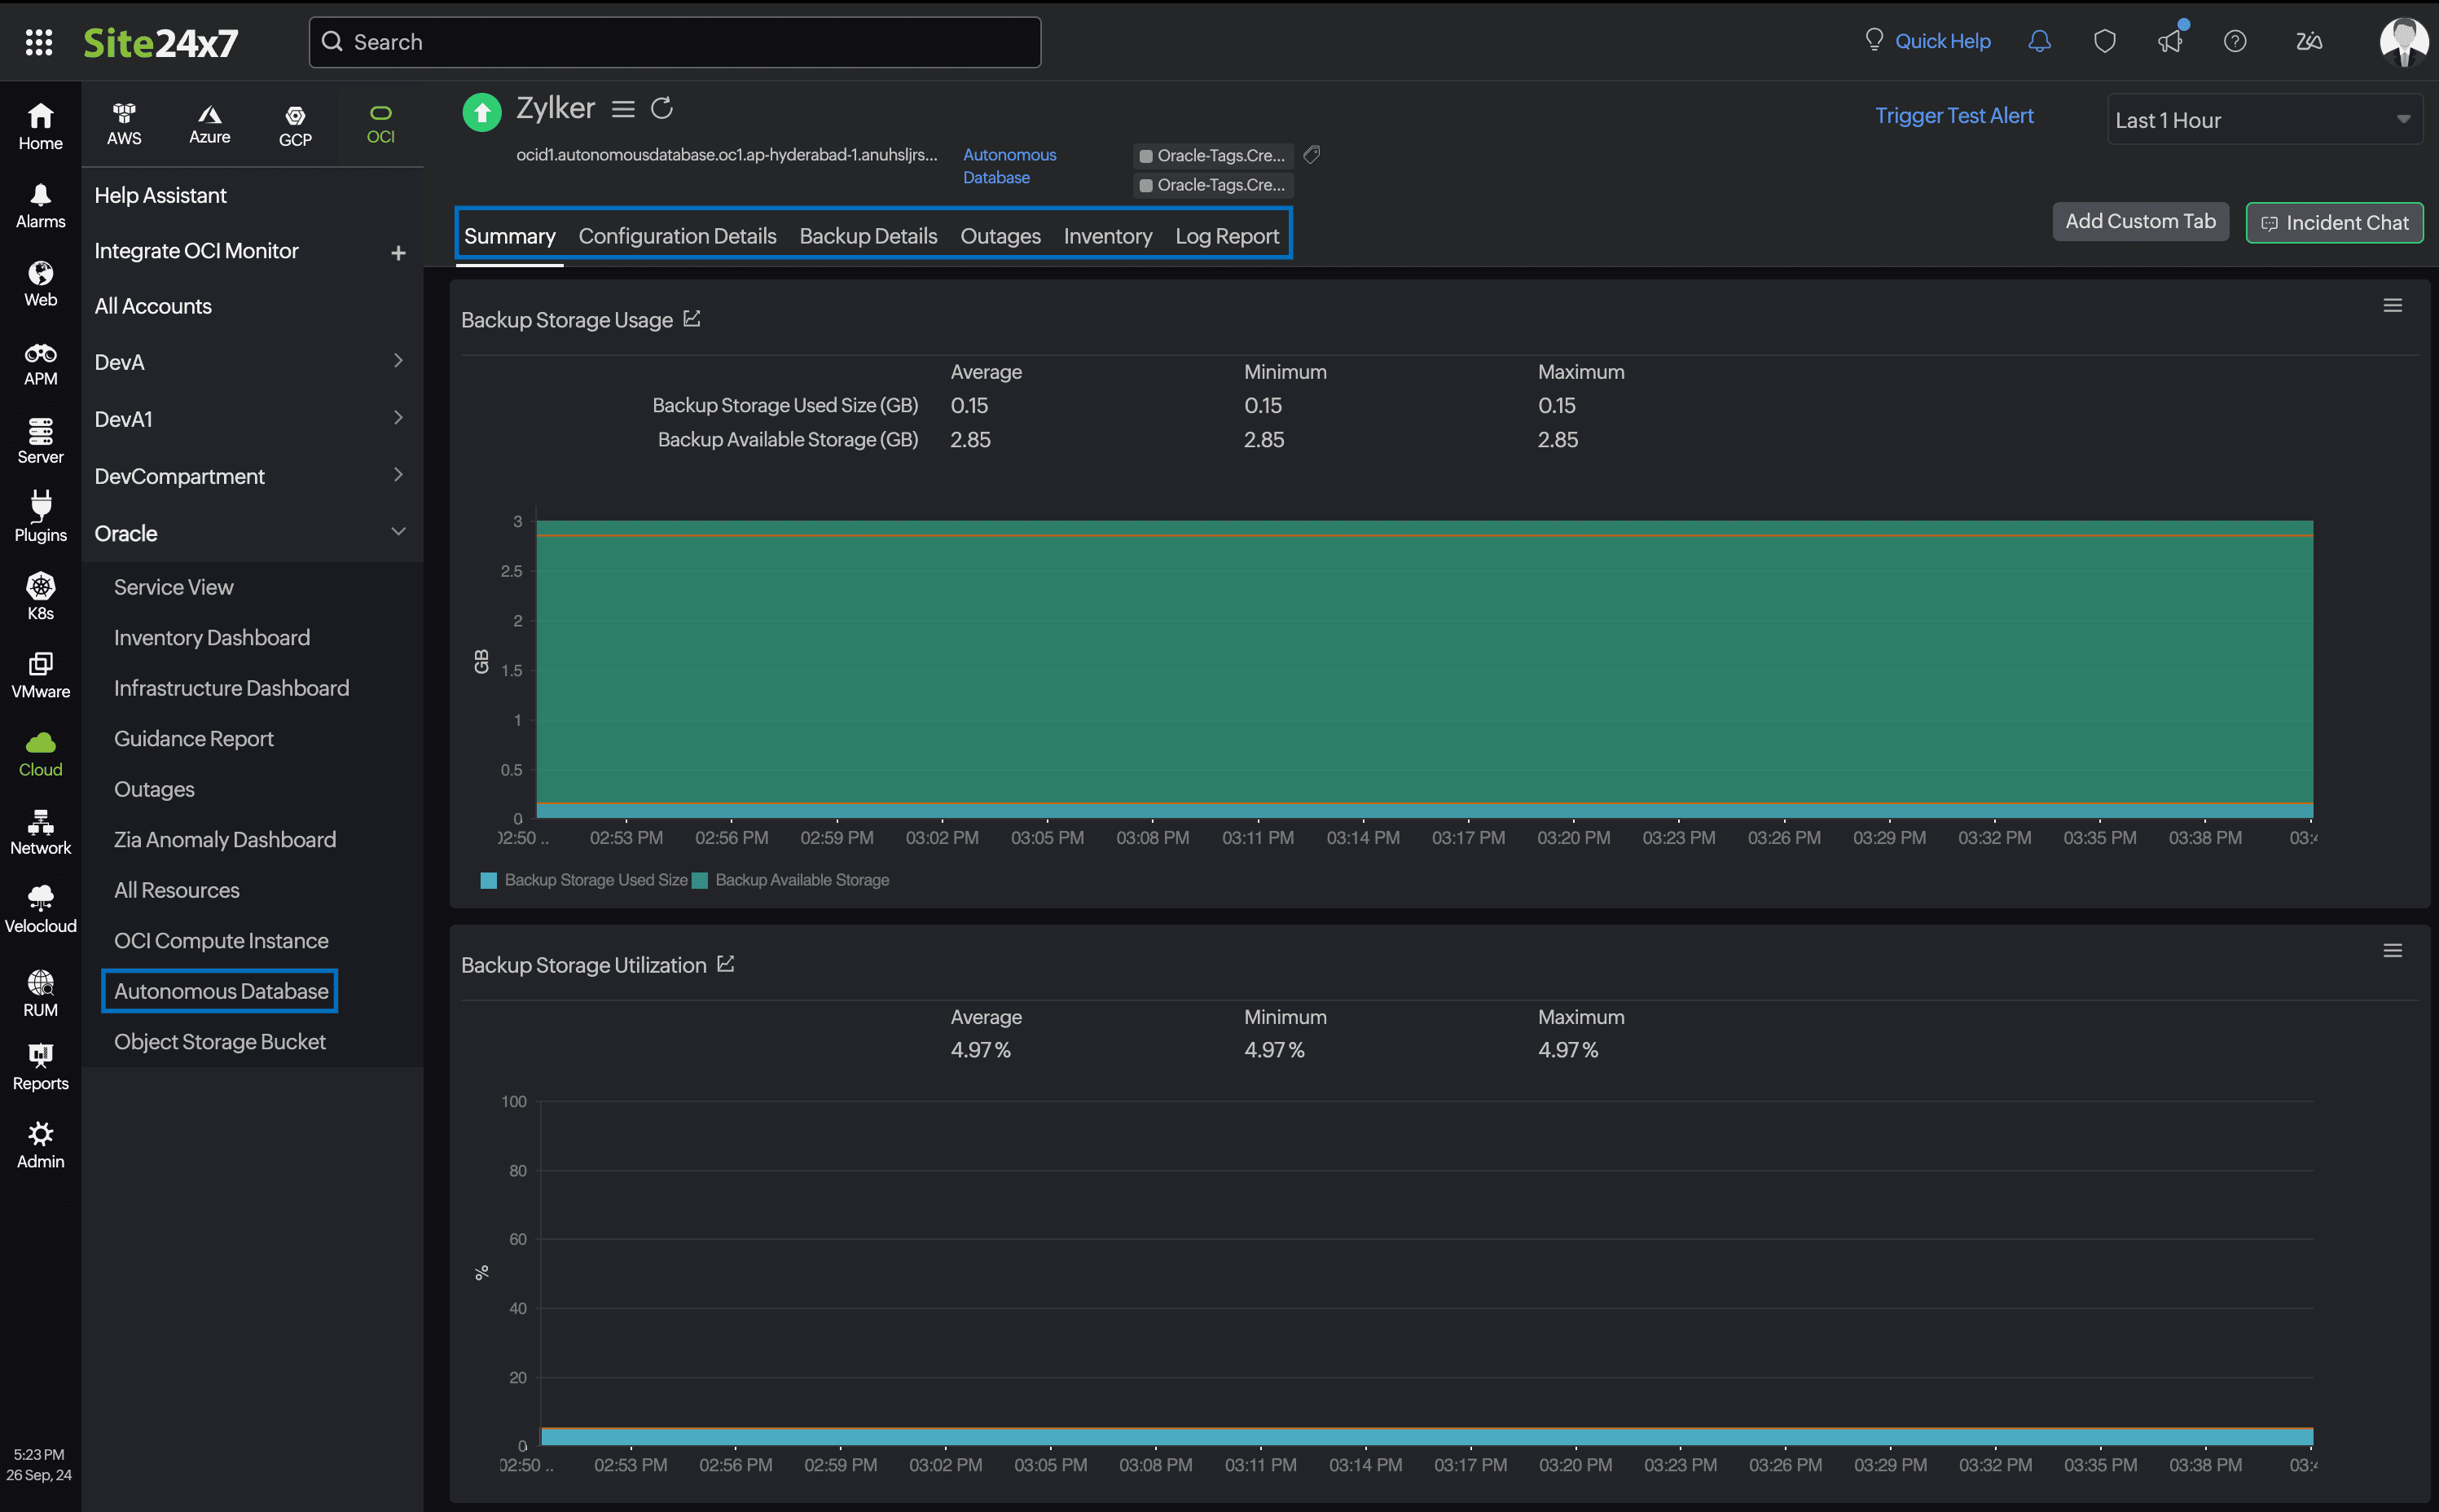
To monitor your Autonomous Database environment, log in to your Site24x7 account and navigate to Cloud > OCI > Autonomous Database.
Monitor data
The monitor data for an Autonomous Database monitor is given below.
Summary
The Summary tab offers a comprehensive overview of the events timeline and metrics, presenting insightful charts that shed light on the performance of your Autonomous Database monitor.
Configuration Details
The Configuration Details tab summarizes essential details of your Autonomous Database, including its deployment type, creation time, disaster recovery data, and backup configuration details.
Backup Details
The Backup Details tab tabularizes the backups created for Autonomous Database. You can view each backup detail by clicking Backup ID.
Outages
The Outages tab provides details on an outage's start time, end time, duration, and comments (if any).
Inventory
Obtain details like Resource Name, Region, Monitor Licensing Category, and much more from the Inventory tab. The Threshold and Availability Profile and the Notification Profile can be set according to the user and viewed in this tab.
Log Report
This tab offers a consolidated report of the Autonomous Database monitor's log status, which can be downloaded as a CSV file.
Related topics