Compute Instance monitoring
Oracle Compute Instance is a virtual machine (VM) or bare-metal server provided by Oracle Cloud Infrastructure (OCI) to run applications and workloads. It acts as a scalable compute resource in the cloud, offering flexibility in terms of the operating system, configuration, and hardware to support a wide range of use cases, including web applications, databases, big data, and high-performance computing.
Overview
Site24x7’s integration with Compute Instance enables comprehensive monitoring of the VMand bare-metal server instances running in the OCI. With this integration, users can track key performance metrics, such as CPU Utilization, Memory Consumption, Network Traffic, and Disk I/O operations, providing real-time visibility into the health and performance of compute resources. This ensures that critical workloads are running efficiently and provides alerts when predefined thresholds are breached.
Use case
An enterprise deploying mission-critical applications on Compute Instances needs to ensure continuous performance and availability. With Site24x7’s integration, the IT team can monitor CPU, memory, and disk usage across multiple Compute Instances in real-time.
For example, if a Compute Instance reaches 90% CPU utilization, Site24x7 triggers an alert, notifying the team to scale up resources or optimize workloads before performance suffers. Historical data provided by Site24x7 also aids in capacity planning, ensuring that the infrastructure scales effectively with growing demand.
Benefits of Site24x7’s Compute Instance integration
Site24x7's integration with Compute Instance provides you with the following benefits:
- Identify and address performance bottlenecks and resource constraints before they impact critical applications with real-time monitoring.
- Obtain critical insights into CPU, memory, and disk usage to optimize resource allocation and improve efficiency.
- Receive instant alerts based on predefined thresholds for performance metrics or when anomalous behavior is detected.
Setup and configuration
- Site24x7 uses cross-tenancy access to monitor your resources using Site24x7's tenancy user. Log in to your Site24x7 account and create a specific policy to allow Site24x7 to view your resources without affecting your security.
- On the Add OCI Monitor page, select Compute Instance from the Services to be discovered list.
Permissions
Ensure that Site24x7 receives the following permissions to monitor the Compute Instance:
- listInstances - INSTANCE_READ
- listVolumeAttachments -INSTANCE_READ
- getVolume - VOLUME_INSPECT
- listBootVolumeAttachments - VOLUME_INSPECT
- getBootVolume - VOLUME_INSPECT
- listVnicAttachments - VNIC_READ (inspect instance-family)
- getVnic - VNIC_READ
Polling frequency
Site24x7 queries OCI service-level APIs according to the set polling frequency (from every minute to once a day) to collect metrics from a Compute Instance monitor.
Supported metrics
The supported metrics for a Compute Instance monitor are provided below.
Compute Instance metrics
The metrics in the below table will be displayed only if monitoring in a Compute Instance is enabled in the OCI console.
| Metric name | Description | Statistics | Unit |
|---|---|---|---|
| CPU Utilization | The activity level from the CPU expressed as a percentage of total time. | Average | Percentage |
| Disk Read Bytes | The Read throughput | Average | Bytes |
| Disk Write Bytes | The Write throughput | Average | Bytes |
| Disk Read I/O | The activity level from I/O reads | Average | Count |
| Disk Write I/O | The activity level from I/O writes | Count | |
| Load Average | The average system load calculated over a one-minute period. | Average | Count |
| Memory Allocation Stalls | The number of times page reclaim was called directly. | Average | Count |
| Memory Utilization | The percentage of space currently in use, measured in pages. | Average | Percentage |
| Network Receive Bytes | The network received throughput | Average | Bytes |
| Network Transmit Bytes | The network transmission throughput | Average | Bytes |
GPU metrics
The metrics listed in the following tables are available for any monitoring-enabled compute instance. To get these metrics, enable monitoring on the instance.
| Metric name | Description | Statistics | Unit |
|---|---|---|---|
| GPU Utilization | The activity level from GPU, expressed as a percentage of total time. | Average | Percent |
| GPU Memory Utilization | The percentage of the GPU memory resource in use. | Average | Percent |
| GPU Power Draw | The amount of GPU power used. | Sum | Integer |
| GPU Temperature | The GPU temperature reported | Maximum | Integer |
| GPU ECC Single Bit Errors | The number of GPU single-bit ECC errors reported. | Count | Integer |
| GPU ECC Double Bit Errors | The number of GPU double-bit ECC errors reported. | Count | Integer |
Fault metrics
| Metric name | Description | Statistics | Unit |
|---|---|---|---|
| Fault | The GPU fault indicator. A value of 0 indicates no faults; a value of 1 indicates faults are detected | Maximum | Count |
RDMA infrastructure health metrics
The metrics listed in the following tables are available for any monitoring-enabled compute instance. To get these metrics, enable monitoring on the instance.
| Metric name | Description | Statistics | Unit |
|---|---|---|---|
| RDMA Aggregate Network Transmit Bytes | The bytes transmitted on the RDMA interface. | Sum | Bytes |
| RDMA Aggregate Network Receive Bytes | The bytes received on the RDMA interface. | Sum | Bytes |
| RDMA Aggregate Network Transmit Packets | The number of RDMA interface packets transmitted. | Sum | Integer |
| RDMA Aggregate Network Receive Packets | The number of RDMA interface packets received. | Sum | Integer |
Fault metrics
| Metric name | Description | Statistics | Unit |
|---|---|---|---|
| RDMA Link Speed Fault | Detects if a link speed fault is present. If the value is 0, there are no faults. If the value is 1, faults are detected. | Maximum | Count |
| RDMA PCIE Address Fault | Detects if a PCIE address fault is present. If the value is 0, there are no faults. If the value is 1, faults are detected. | Maximum | Count |
| RDMA PCIE BER Check Fault | Detects if a PCIE BER fault is present. If the value is 0, there are no faults. If the value is 1, faults are detected. | Maximum | Count |
| RDMA PCIE Cable Flap Fault | Detects if a PCIE cable flap fault is present. If the value is 0, there are no faults. If the value is 1, faults are detected. | Maximum | Count |
| RDMA PCIE Cable Plug Fault | Detects if a PCIE cable plug fault is present. If the value is 0, there are no faults. If the value is 1, faults are detected. | Maximum | Count |
| RDMA PCIE Cable State Fault | Detects if a PCIE cable state fault is present. If the value is 0, there are no faults. If the value is 1, faults are detected. | Maximum | Count |
Other supported metrics
| Metric name | Description | Statistics | Unit |
|---|---|---|---|
|
Infrastructure Health Status |
The number of health issues for an instance. Any non-zero value indicates a health defect. This metric is available only for bare-metal instances. |
Sum |
Count |
|
Instance Status |
The status of a running instance. A value of zero indicates that the instance is available (up). A value of one indicates that the instance is not available (down) due to an infrastructure issue. If the instance is stopped, then the metric does not have a value. This metric is available only for VM instances. |
Sum |
Count |
|
Maintenance Status |
The maintenance status of an instance. A value of zero indicates that the instance is not scheduled for an infrastructure maintenance event. A value of one indicates that the instance is scheduled for an infrastructure maintenance event. This metric is available for both VM and bare metal instances. |
Maximum |
Count |
|
Instance accessibility status |
The accessibility status of a VM instance. A value of one indicates that the instance is unresponsive due to an issue with the infrastructure or the instance itself. A value of zero indicates that an accessibility issue has not been detected. If the instance is stopped, then the metric does not have a value. |
Maximum |
Count |
|
Instance Metadata Requests V1 Versus V2 |
The number of requests to the instance metadata service, comparing the V1and V2 endpoints. |
Sum |
Count |
Threshold configuration
To configure thresholds for a Compute Instance monitor:
- Log in to your Site24x7 account and navigate to Admin > Configuration Profiles > Threshold and Availability.
Click Add Threshold Profile. - Select Compute Instance from the Monitor Type drop-down menu and provide an appropriate name in the Display Name field.
- The supported metrics are displayed in the Threshold Configuration section. You can set threshold values for all the metrics mentioned above.
- Click Save.
Forecast
Estimate future values of the CPU Utilization, Bytes Sent, and Bytes Received metrics with the Forecast feature. Predict future points of these performance metrics (measurement of resource usage) based on historical observations and make informed decisions.
IT Automation
You can add automations to start, stop, or restart Compute Instance. Go to Admin > IT Automation Templates (+) > Add Automation Templates. Once automations are added, you can schedule them to be executed one after the other.
Licensing
Each Compute Instance monitor utilizes two basic monitor licenses.
Compute Instance and Server agent integration
Site24x7 seamlessly integrates OCI Compute Instances with the Site24x7 Server monitoring agent, providing complete visibility into your instance performance. This integration automatically combines instance-level metrics with in-depth server insights, creating a unified and comprehensive monitoring experience.
Viewing Compute Instance monitor data
To monitor your Autonomous Database environment, log in to your Site24x7 account and navigate to Cloud > OCI > Compute Instance.
Monitor data
The monitor data for the Compute Instance monitor is given below.
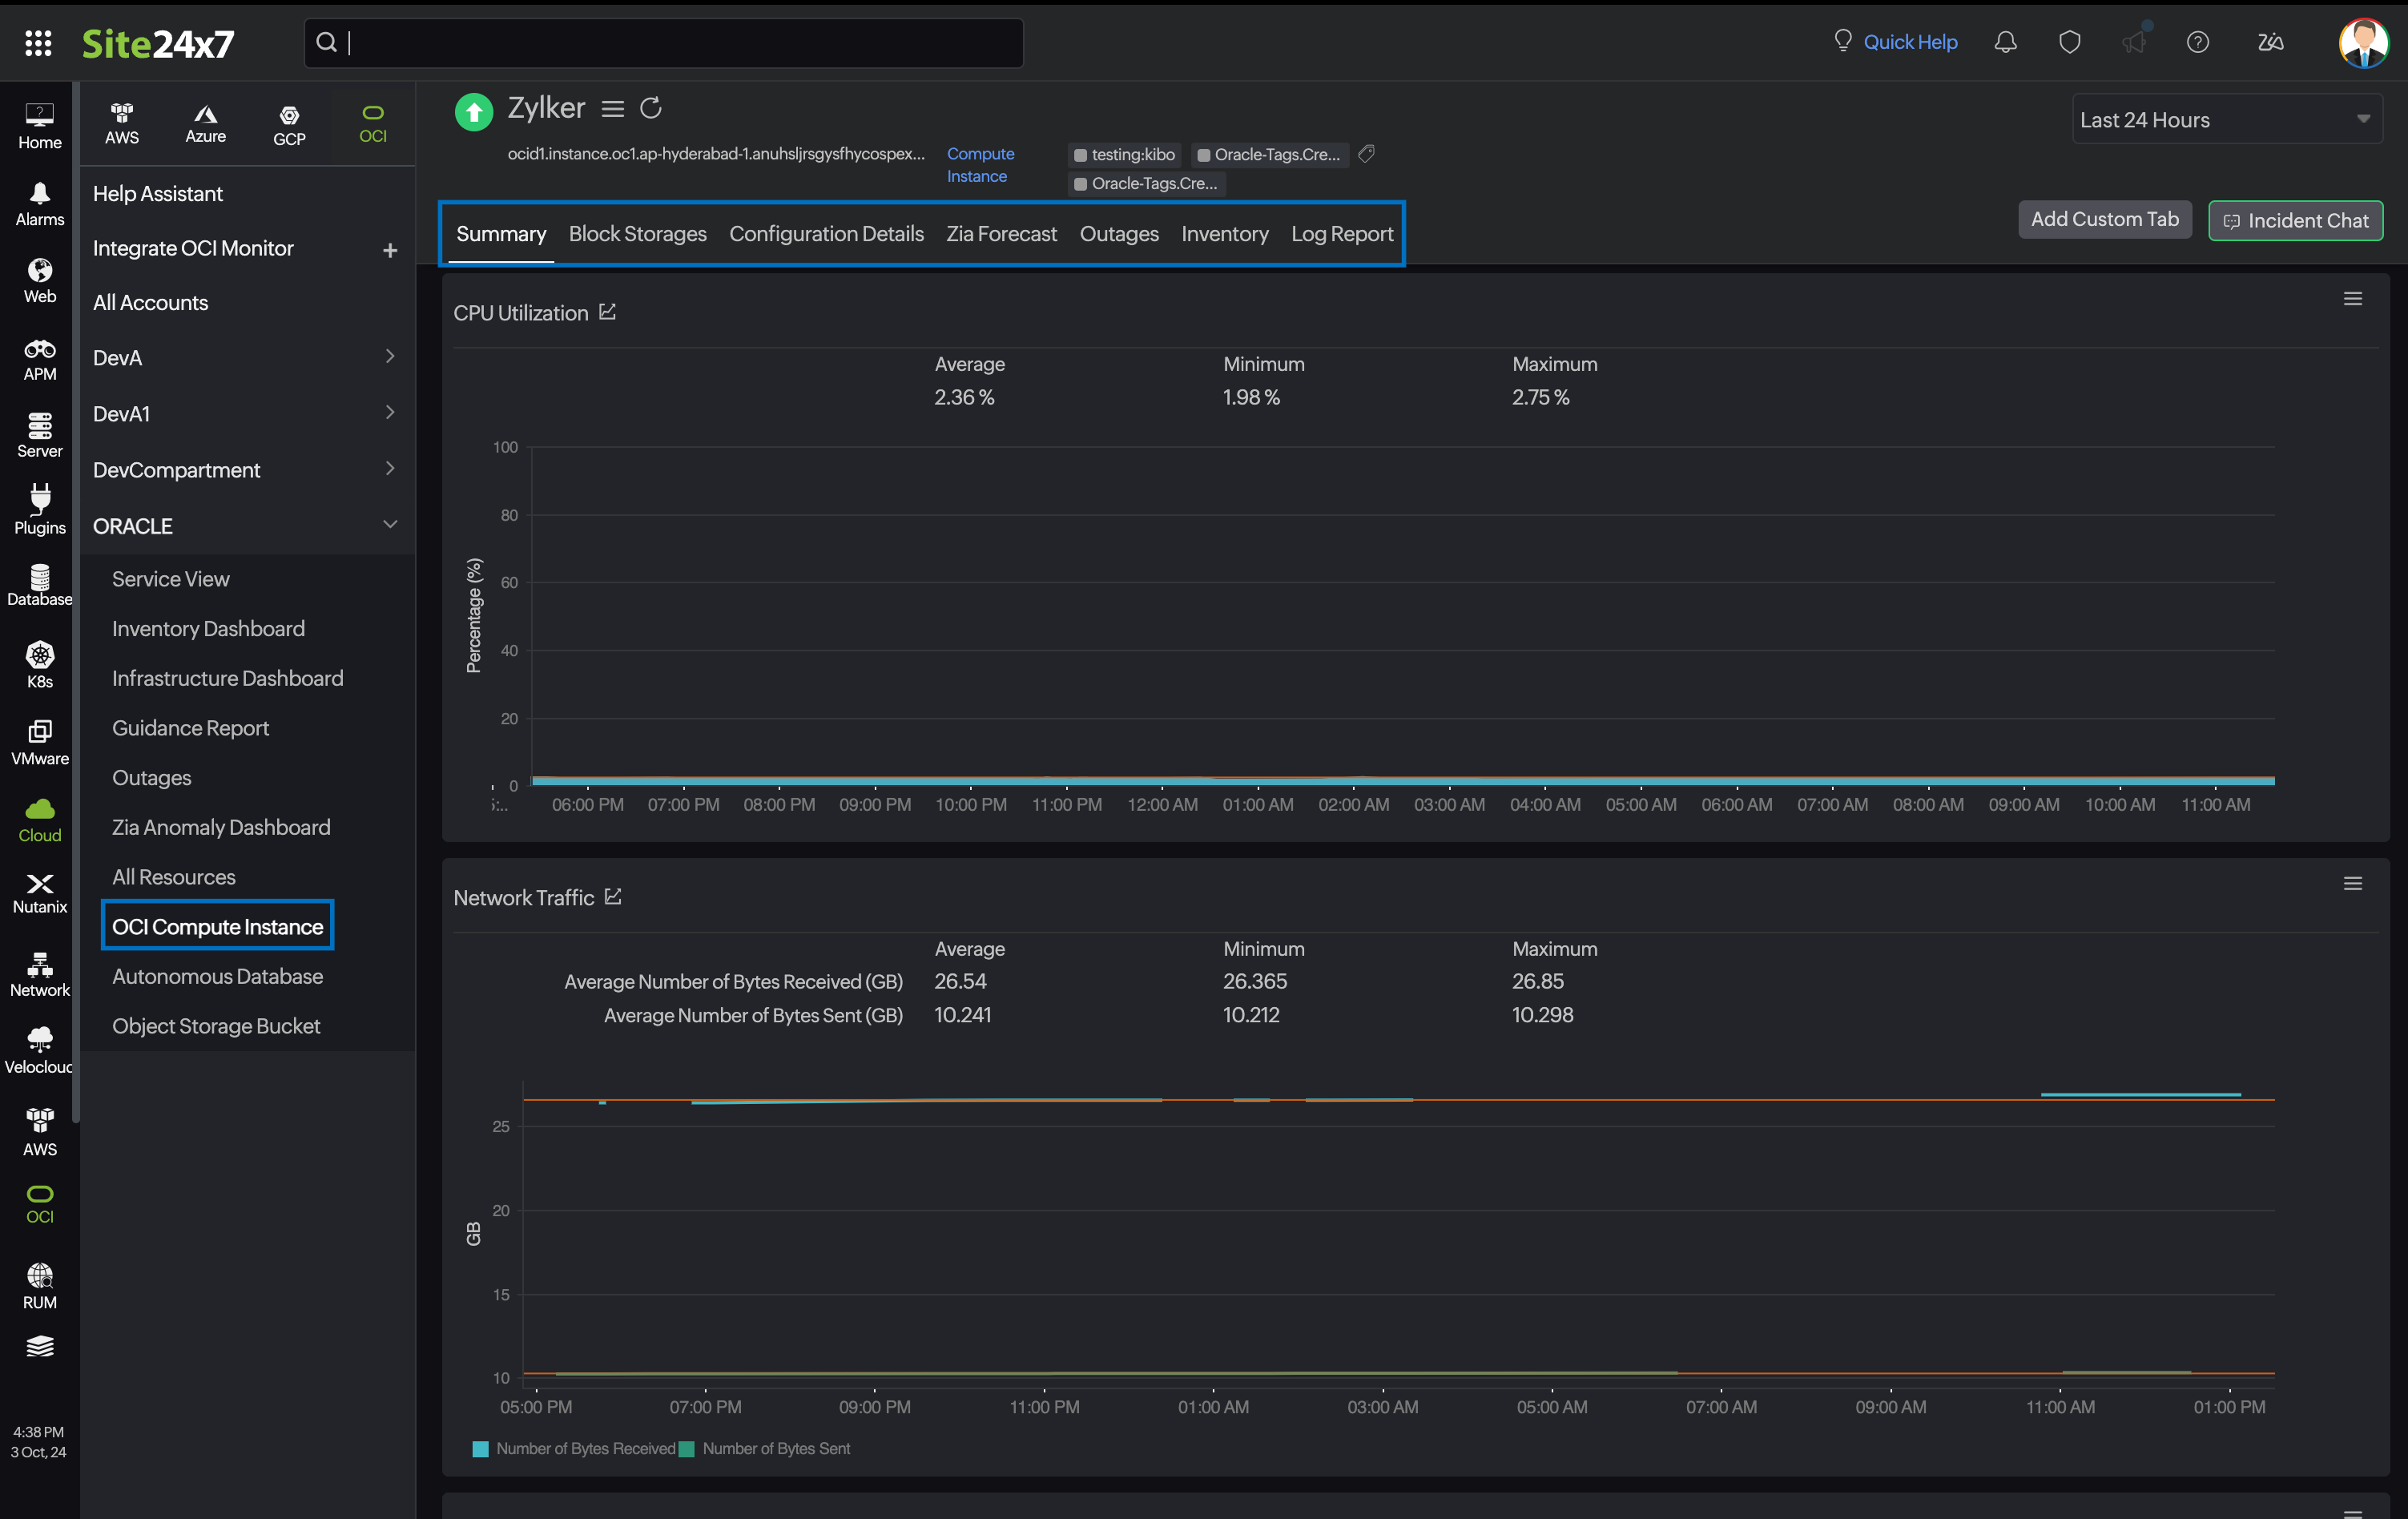
Summary
The Summary tab offers a comprehensive overview of the events timeline and metrics, presenting insightful charts that shed light on the performance of Compute Instance.
Block Storage
Compute Instances will have boot volumes created in the same compartment and can also provision and manage block volumes dynamically. The Block Storage tab provides a list of blocks and boot volume monitors, their availability, and status. Click the monitor name hyperlink to view the Block Storage monitor data.
Configuration Details
The Configuration Details tab summarizes essential details of Compute Instance, including its Image ID, Created Time, Shape, and other configuration details.
Outages
The Outages tab provides details on an outage's start time, end time, duration, and comments (if any).
Inventory
Obtain details like Resource Name, Region, Monitor Licensing Category, and much more from the Inventory tab. The Threshold and Availability Profile and the Notification Profile can be set according to the user and viewed in this tab.
Log Report
This tab offers a consolidated report of the Compute Instance monitor's log status, which can be downloaded as a CSV file.
Related topics
- Integrate your OCI resources with Site24x7
- Compute Instance and server agent integration
- View advanced configurations
- Configure notifications and thresholds
- View performance metric polling interval
- View Inventory dashboard
- View Infrastructure dashboard
- Configure OCI uptime monitoring
- Configure Tags for monitoring
- View metric profile