OCI Inventory Dashboard
The OCI Inventory Dashboard serves as a centralized platform to track the total resource count and metadata for your monitored OCI compartments, organized by various configurations like regions and timeframes. It offers detailed insights into active monitored resources, historical resource changes, an in-depth inventory report on enabled services, a regional breakdown of resources, and best practice recommendations through the Guidance Report for your OCI monitors.
Widgets
With a collection of powerful widgets, the Inventory Dashboard offers you a real-time snapshot of your cloud infrastructure. Let’s dive into the various widgets that make this dashboard essential for effective OCI monitoring and management.
OCI Monitored Resources
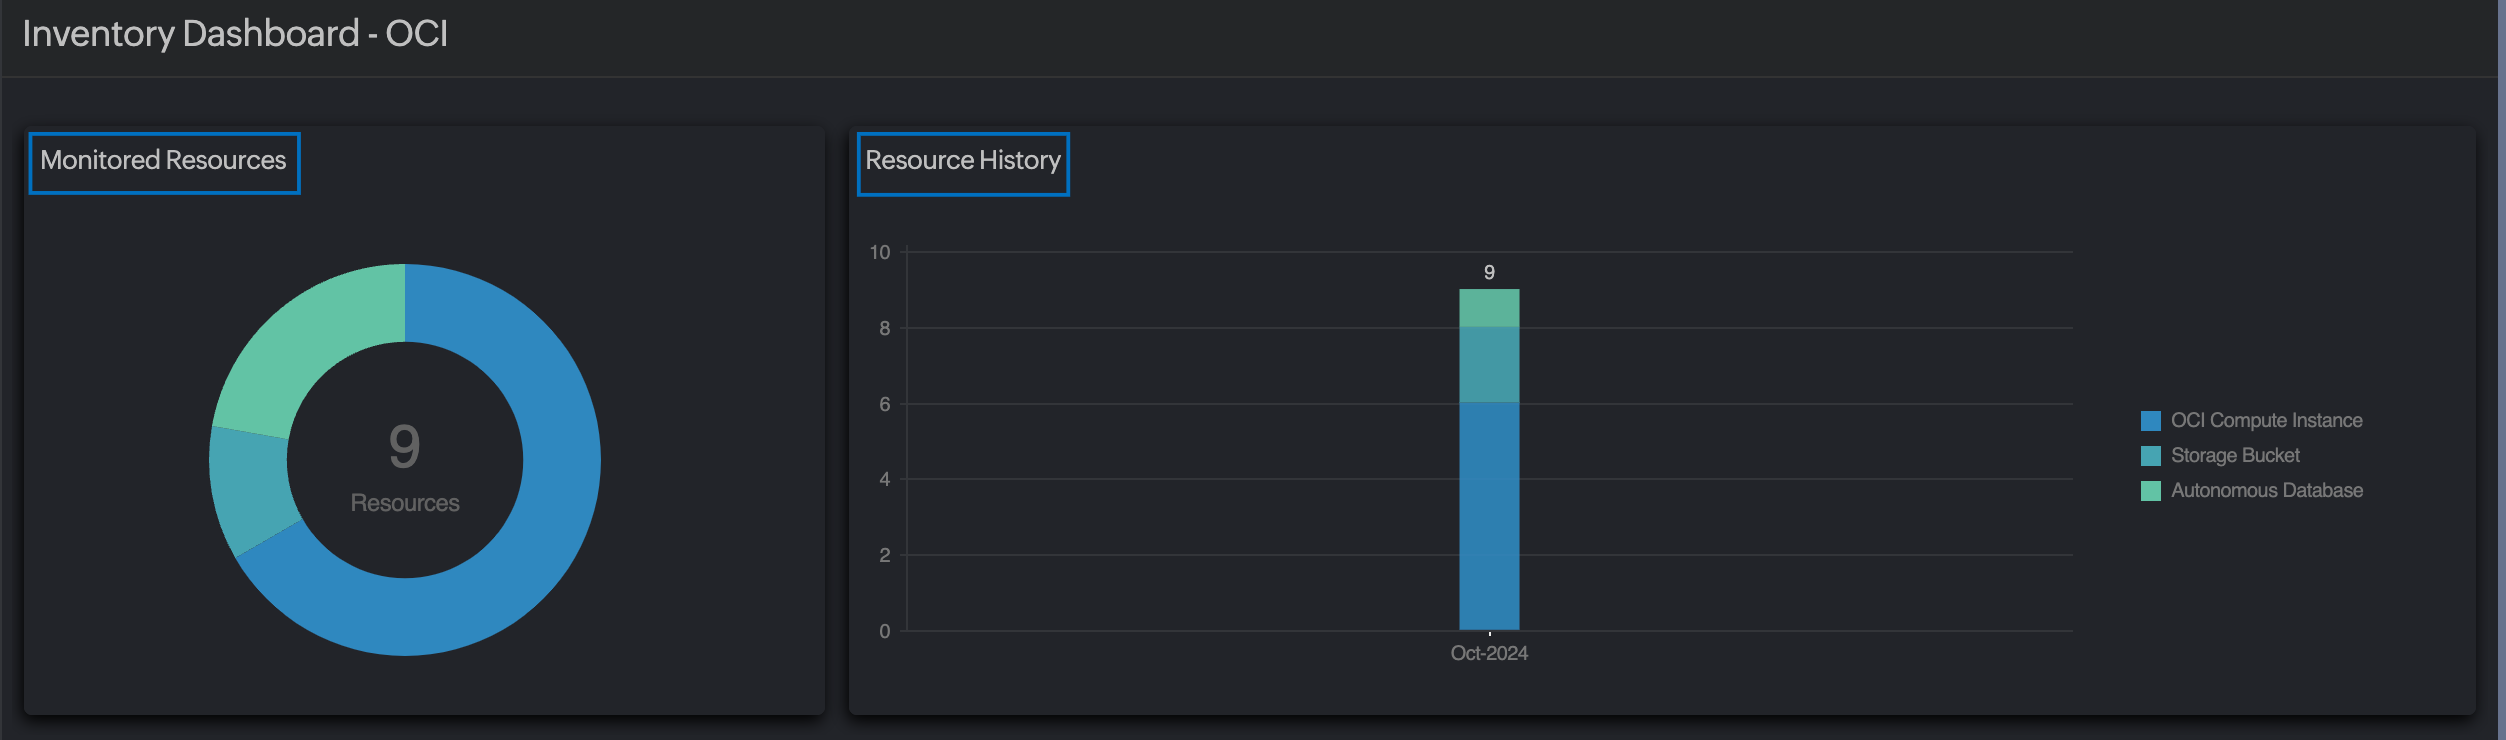
The OCI Monitored Resources widget shows the total number of active monitored OCI resources linked to your OCI compartment is shown alongside a donut chart, which visually represents these resources by service type. Each ring in the chart represents a specific monitored OCI service, and you can hover over the rings to see the percentage each service contributes to the overall resource count. Any service selected for discovery during the creation of an OCI compartment monitor will generate a corresponding ring in the chart.
Resource History
The Resource History widget features a stacked bar chart that illustrates the various OCI services configured during a month. Each OCI service is represented by a distinct legend, enabling easy identification of the resource types. Additionally, each stacked bar displays the total number of OCI resources configured within that month.
Enabled Services
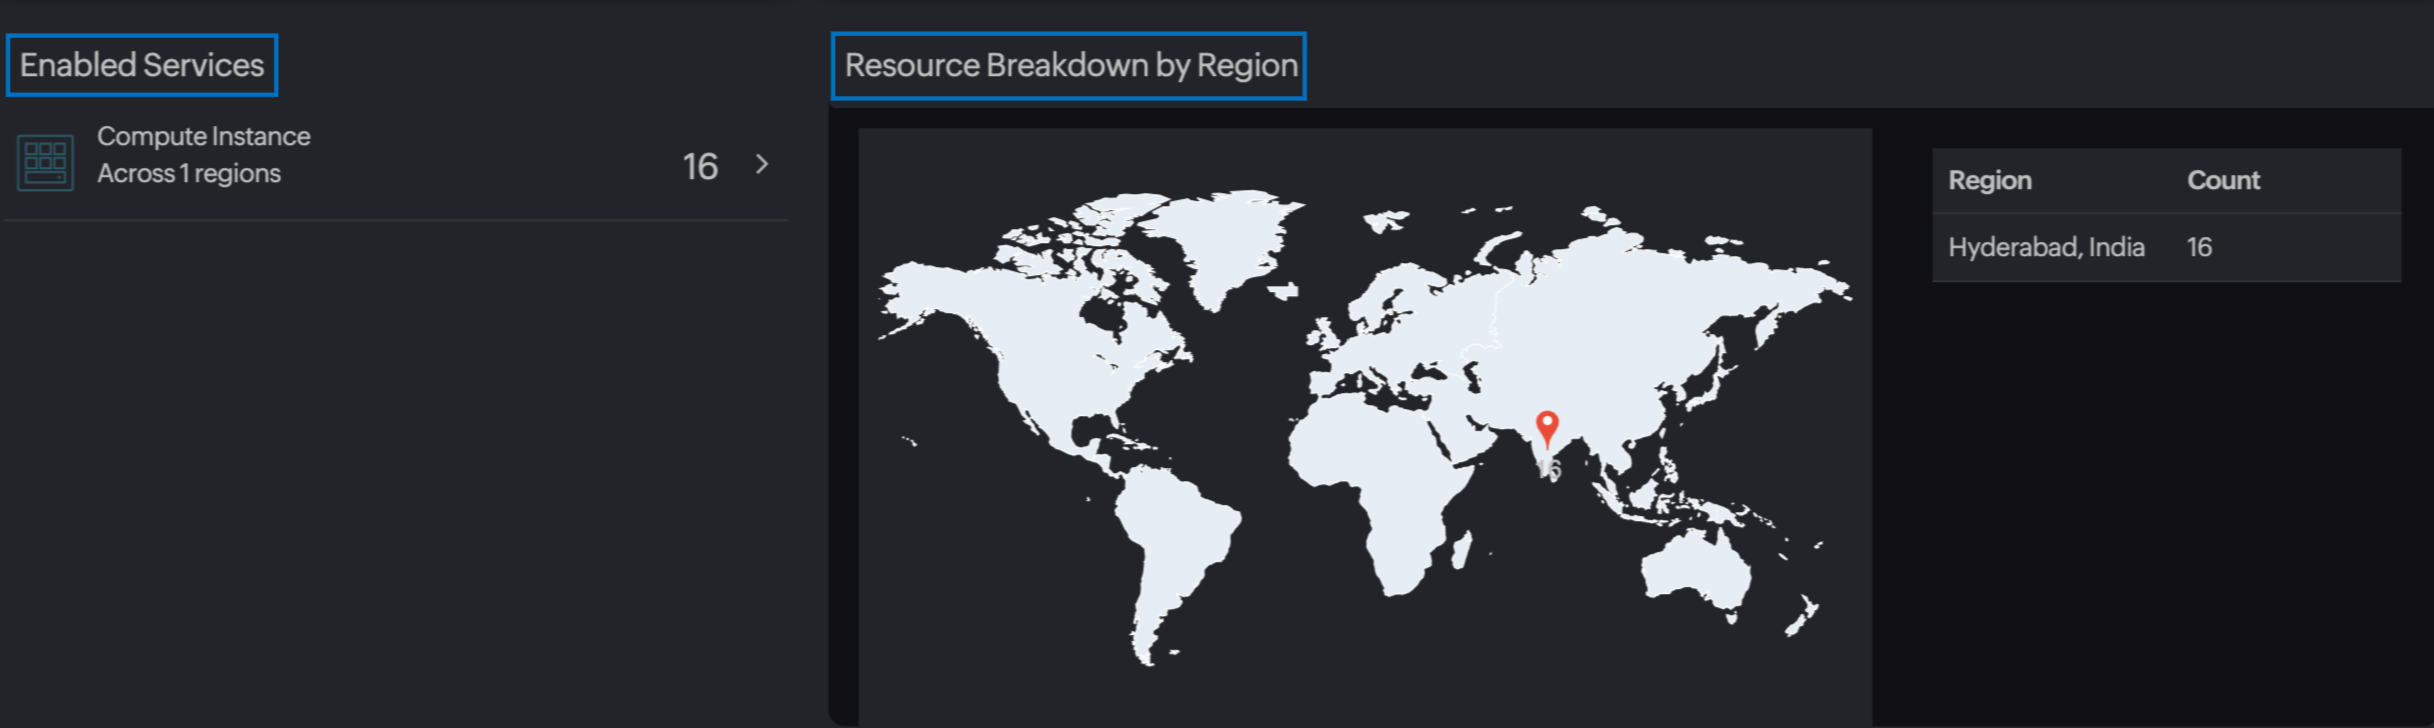
The Enabled Services widget allows you to see a real-time breakdown of your OCI services within your monitor. It displays a list of all OCI services, including the number of each individual service and the number of OCI regions where they are distributed. Furthermore, you can access detailed reports for each resource by clicking the service icon within the widget.
Resource Breakdown by Region
With the Resource Breakdown by Region widget, view your OCI services according to the OCI regions where they are set up. You can access a global map that illustrates the number of services in each OCI region where your resources are configured. You also get region-based service count split-up data displayed in a table.
Guidance Report
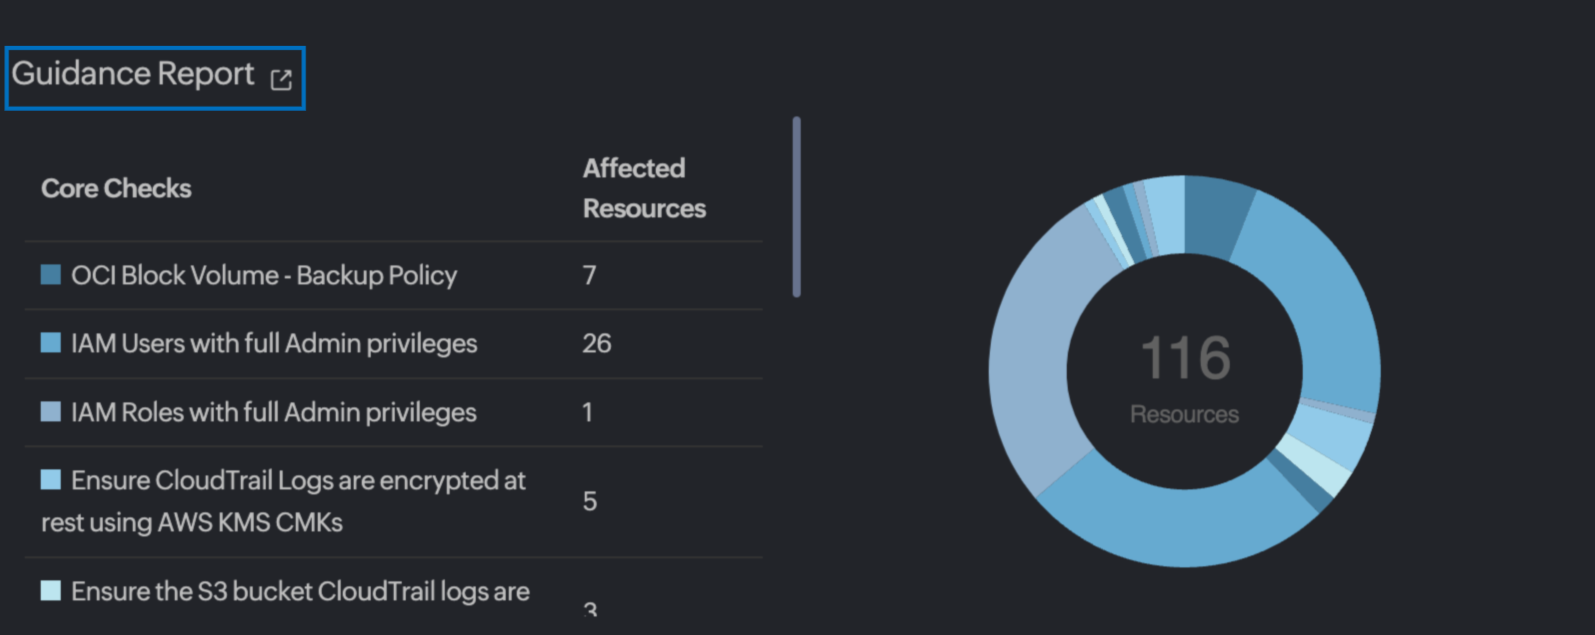
Site24x7’s Guidance Report for OCI offers a series of best practice recommendations tailored to enhance performance, reliability, and cost efficiency. The Guidance Report widget showcases the key checks along with the count of impacted resources, all based on your OCI monitor’s configuration.
OCI Service Inventory Report
The OCI Service Inventory Report provides a comprehensive overview of the performance of your various OCI services over a specified time range. In the upper section of the report, choose the specific OCI resource from the Monitors field and the desired time granularity for the report from the Time Period field. The report also includes widgets such as the Live Inventory, Monitored Inventory, and Group By. Additionally, at the bottom of the report, you can view detailed metadata of your resources of a selected type.
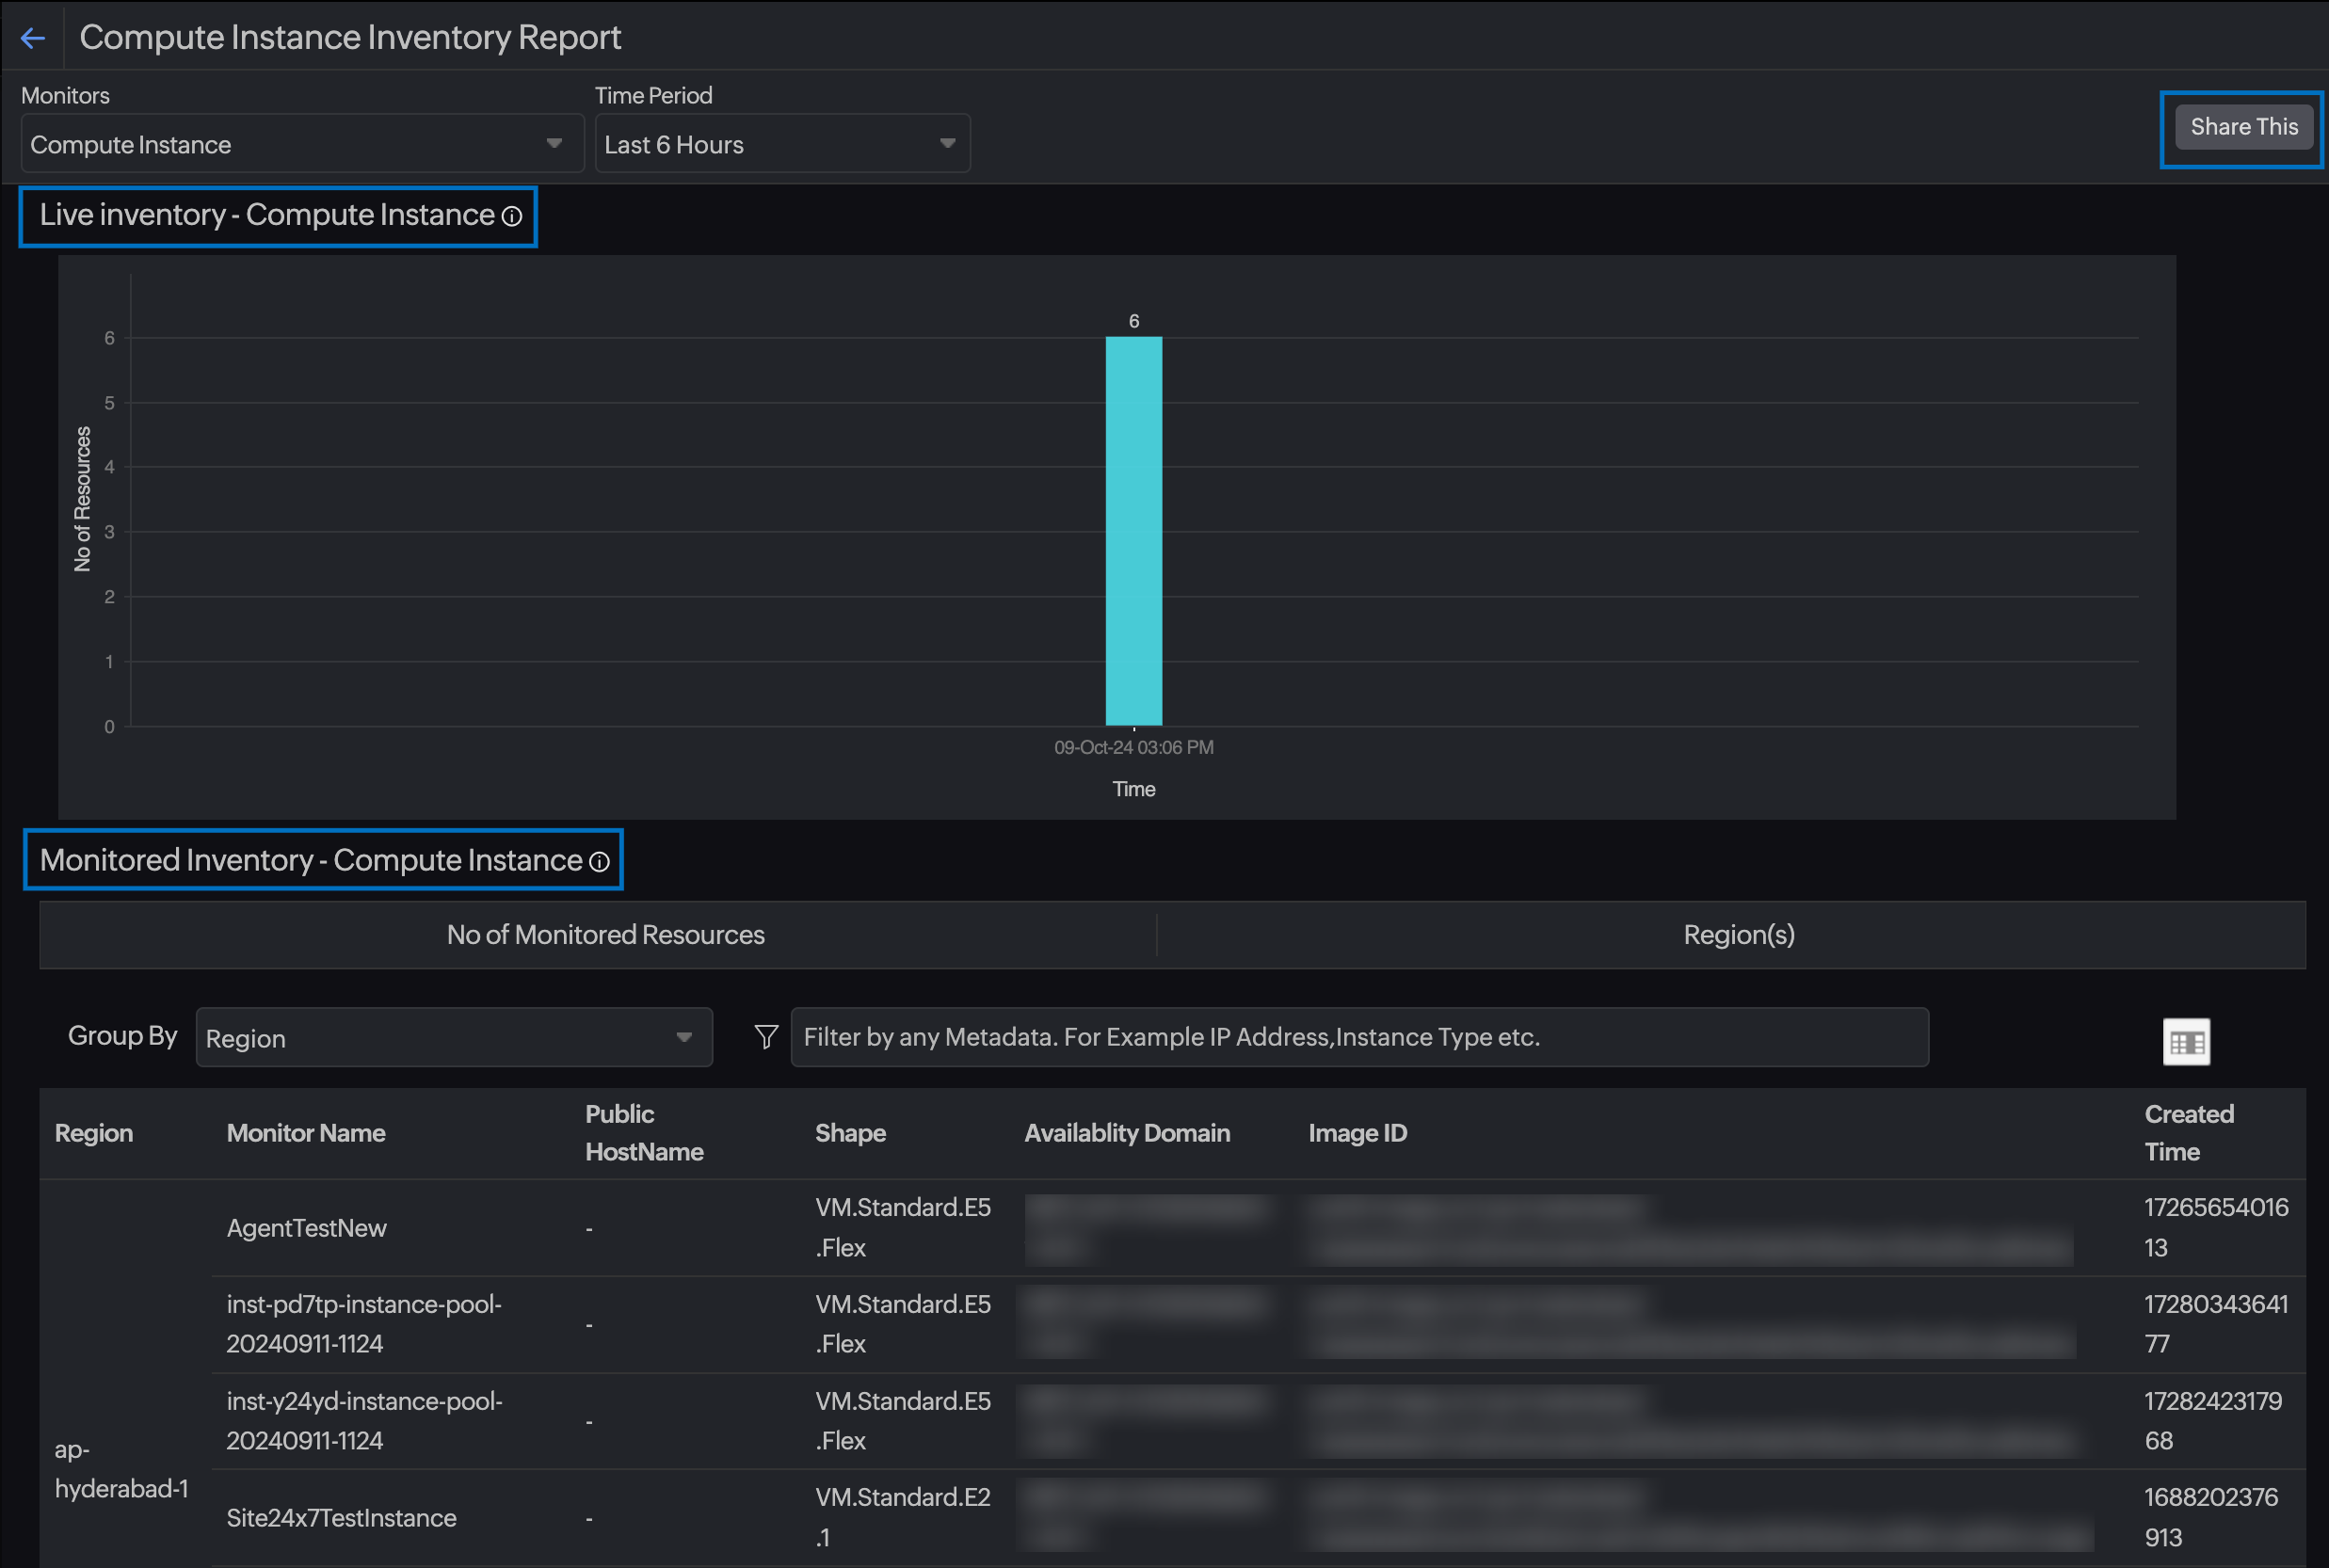
For example, let's say you've selected OCI Compute Instance as your default resource type and Last Month as your time period. The Live Inventory widget for OCI Compute Instance will show the actual changes to the monitored OCI Compute Instances from the date and time when it was first configured in the compartment. The data is plotted on a bar chart with the Y axis showing the number of OCI Compute Instances and the X axis defining the date and time stamp when the Compute Instance metric collection was activated or deleted. The suspended resources are not included in the graph. Additionally, you can view the number of enabled OCI Compute Instances and the regions that they are scattered in from the other widgets.
A detailed inventory information for the selected OCI resource type will be displayed at the bottom of this report based on the Group By filter and the metadata selected. For example, if you've selected OCI Compute Instance type, all the monitored Compute Instances and their corresponding metadata and configuration information will be displayed. You can also use the column filter to add or remove metadata from the view.
Share Inventory Report
You can use the Share button to export the Inventory Report as a PDF, CSV, or email notification.
Schedule Inventory Report
You can schedule your OCI Inventory Report and share it with your desired users over email on a daily, weekly, or monthly basis. Follow the steps below to schedule an Inventory Report:
- Log in to Site24x7.
- Navigate to Admin > Report Settings > Schedule Reports.
- Click the Schedule Reports button.
- Fill in the following fields to set up your OCI Inventory Report:
- Display Name: Provide a unique name for your report.
- Report Type: Pick OCI Inventory Report from the drop-down list.
- Choose Monitor: Pick your OCI Monitor from the drop-down list.
- OCI Resource Type: Select the OCI resource type so you can share specific inventory details about the selected resource type.
- Report Format: You can only share the report in PDF.
- Frequency: The frequency of the report can be set as daily, weekly, monthly, or quarterly.
- Reporting Period: Based on your set frequency, you can further define the exact date and time when you want the report to be sent.
- Time Zone: Select the desired time zone.
- Reporting Time: The time format (12 or 24 hours) selected in the account-level configuration will be displayed here. You can make changes by navigating to My Accounts.
- Send Report to: Pick the user group with whom the report must be shared.
- Once the details have been furnished, click Save. Or, trigger a report instantly by clicking Send Now.
Related topics
-
On this page
- Widgets
- OCI Service Inventory Report
- Schedule Inventory Report