Prometheus Integration
Prometheus is an open-source monitoring tool that extracts metrics from predefined endpoints and stores them as time-bound data.
The Prometheus-integrated Site24x7 Server agent is an all-in-one metrics aggregation and alerting toolkit. With this toolkit, you can monitor the performance of your applications at one time, get precise reports, build custom dashboards, integrate with third-party applications, set automation to have corrective measures, and balance loads efficiently.
How it works
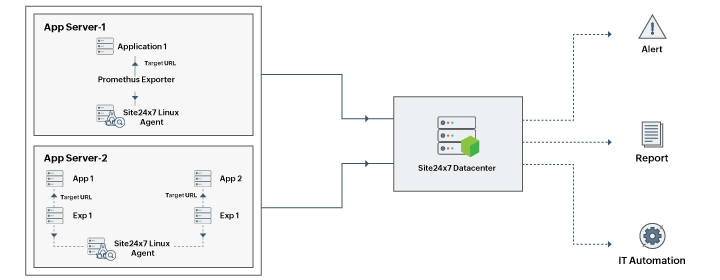
Prometheus collects the metrics from multiple applications and services in the server environment and generates alerts that get recorded in the predefined target URLs. The Site24x7 server monitoring agent automatically reaches the Prometheus target URLs at predetermined intervals to pull those metrics and send them to the Site24x7 server. The server then processes the metrics from the URL and generates a visual representation of these metrics. Site24x7 employs corrective measures, if needed, using IT Automation. You can generate user-specific reports, create custom dashboards, collaborate with third-party integrations to receive instant alerts, and use IT automations to resolve issues in real time. You also have the flexibility to set thresholds, receive alerts, and procure accurate metrics in classified reports anytime.

To accomplish this, Prometheus uses exporters. Prometheus supports more than 160 exporters. Here is a comprehensive list of the categories of exporters.
Prerequisites
- Ensure that your Linux server monitoring agent is version 18.4.0 or above and is enabled for Prometheus.
- Ensure that you download the exporter you want to monitor by following the steps mentioned in the respective ReadMe file.
- Ensure that you build, compile, and run the exporter. This will enable you to obtain the target URL, the URL where all the metrics will be exposed for monitoring.
- Ensure that the target URL of the exporter is configured without errors during integration. The target URL should be accessible; if it's not, an error message will result.
Command-line integration for a new Site24x7 server monitoring agent
Follow these steps if you are installing a Site24x7 Server Monitoring agent for the first time.
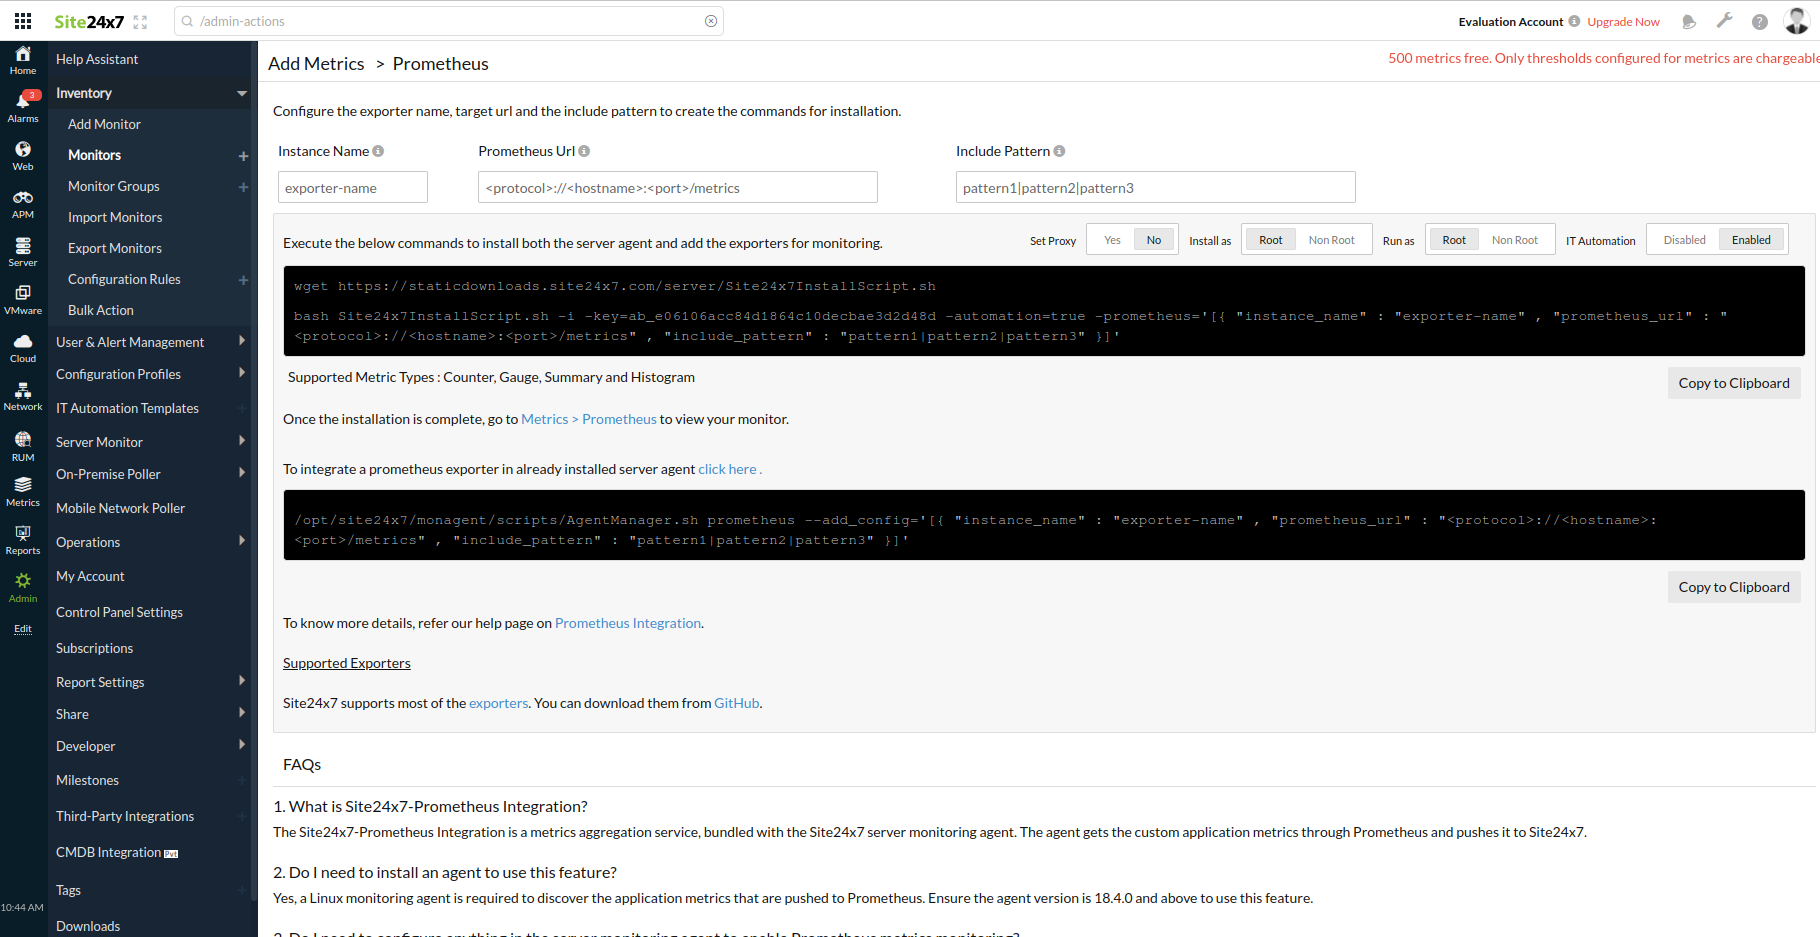
- Go to Admin > Inventory > Add Monitor.
- Select Prometheus Integration.
- Use the toggle button to install the agent as root or non root, and run the agent as root or non root after installation. You can enable or disable automation in this step.
- Provide the Instance Name, Prometheus URL, and add the metrics you would like to monitor or use a regex pattern if you like to monitor one or more metrics that match the defined patterns.
- Copy and execute the command to install the agent and to enable Prometheus monitoring.
For example, the following command can be executed for the condition:
To monitor the metrics that matches the name, gc or memstats, when Node exporter is integrated with the Site24x7 Server Monitoring agent. The agent will be installed as a root user, and run as non root with proxy enabled.
wget https://staticdownloads.site24x7.com/server/Site24x7InstallScript.sh
bash Site24x7InstallScript.sh -i -key=xxxxxxxxxxxxxxxxxxxxxxxxx -proxy=user:password@proxyhost:proxyport -s24x7-agent -prometheus='[{ "instance_name" : "node-exporter" , "prometheus_url" : "http://localhost:9100/metrics" , "include_pattern" : "gc|memstats" }]'

The metrics exposed through the Prometheus URL are thus collected. After executing these commands, the agent will push the metrics automatically.
Command-line integration if the agent is already installed
For an already installed agent, follow these steps:
- Go to the agent-installed path: <Agent-Installed-folder>/site24x7/monagent/
- Execute the following command to integrate the exporter:
<Agent-Installed-folder>/site24x7/monagent/scripts/AgentManager.sh prometheus --add_config='[{"prometheus_url": "<url>","include_pattern": "<pattern_1>|<pattern_2>","instance_name": "<instance_name_to_add>"}]' - After executing these commands, the agent will restart automatically.
For example, the following command can be executed for the condition:
To monitor the metrics that matches the name, gc or memstats, when Node exporter is integrated with the Site24x7 Server Monitoring agent installed as a root user.
/opt/site24x7/monagent/scripts/AgentManager.sh prometheus --add_config='[{"instance_name": "node-exporter", "prometheus_url": "http://localhost:9100/metrics","include_pattern": "gc|memstats"}]'
The metrics exposed through the Prometheus URL are thus collected.
To remove an exporter use the following command:
<Agent-Installed-folder>/site24x7/monagent/scripts/AgentManager.sh prometheus --remove_config='[{"instance_name": "exporter_name_to_remove"}]'You can use * as include_pattern to monitor all the metrics. Use * with caution as this might result in sending a huge number of metrics.
Manual integration
Install Site24x7 server monitoring agent and follow these steps to integrate Prometheus.
- Go to Server monitoring agent Home: /site24x7/monagent/metrics/prometheus/prometheus.cfg.
- By default, Prometheus will remain disabled. Update the value from enabled = false to enabled = true.
- Configure the target instance data. Format:
[exporter-name]
prometheus_url = <target url of the exporter>
include_pattern = <pattern_1>|<pattern_2>
- Restart the server monitoring agent.
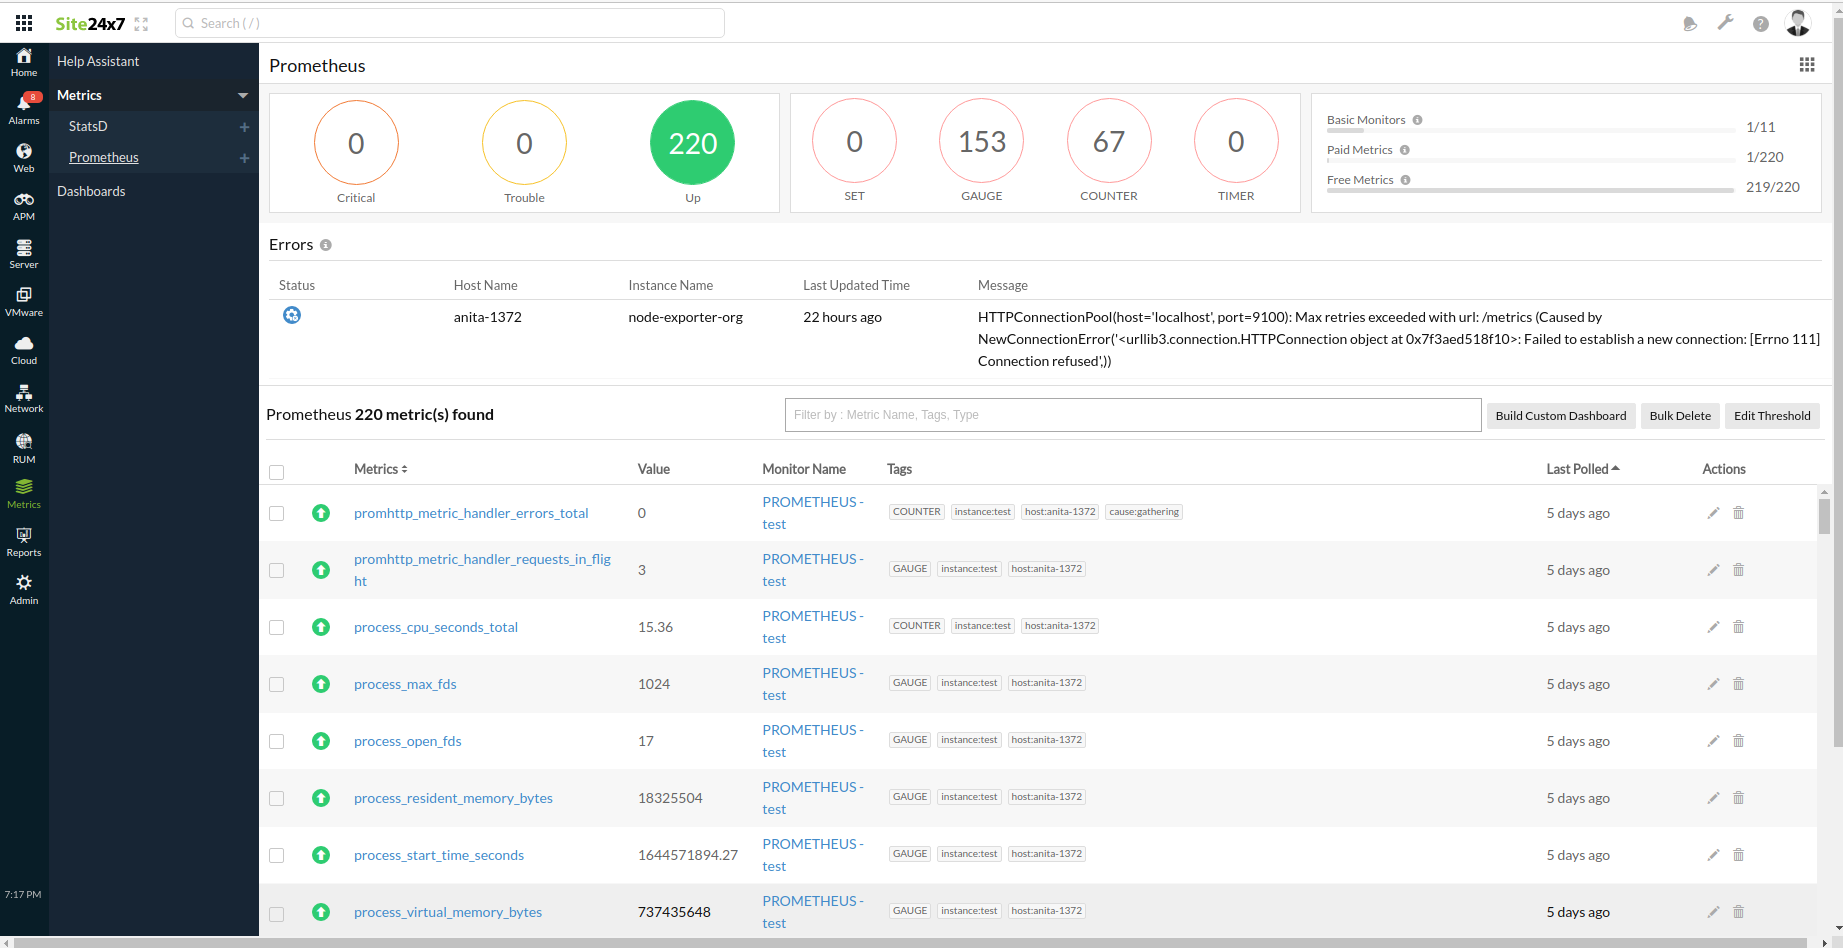
You are all set. Now the agent will start sending the metrics to your Site24x7 web client portal. Go to Metrics > Prometheus to view them and add thresholds.

A monitor will be created for each exporter you integrate. Go to Metrics > Prometheus to view them.
Sample configuration
- Download an exporter from GitHub to use to monitor. We are using node-exporter as a sample.
- Follow the steps given in the ReadMe file of that monitor for compilation.
- Run the exporter using the following command:
./node-exporter - You can now view the metrics in the URL: http://localhost:9100/metrics
Use this URL as the Target URL for monitoring Node Exporter using Site24x7 agent. - Execute the following command in the installed path:
<Agent-Installed-folder>/site24x7/monagent/scripts/AgentManager.sh prometheus --add_config='[{"prometheus_url": "http://localhost:9100/metrics","include_pattern": "node|gc","instance_name": "node-exporter"}]'
You can now view all the metric names that matches "node" and "gc" from Metrics > Prometheus.
Performance metrics
Gauge, Counter, Histogram, and Summary data can be monitored using the Prometheus-integrated Site24x7 server agent. All the metrics pushed through the Prometheus Metrics monitoring protocol to Site24x7 can be seen under Metrics > Prometheus. You can search for them based on their name, tags, or type. All the hostnames and the target instance names will also be added as tags to the metrics.
Set thresholds
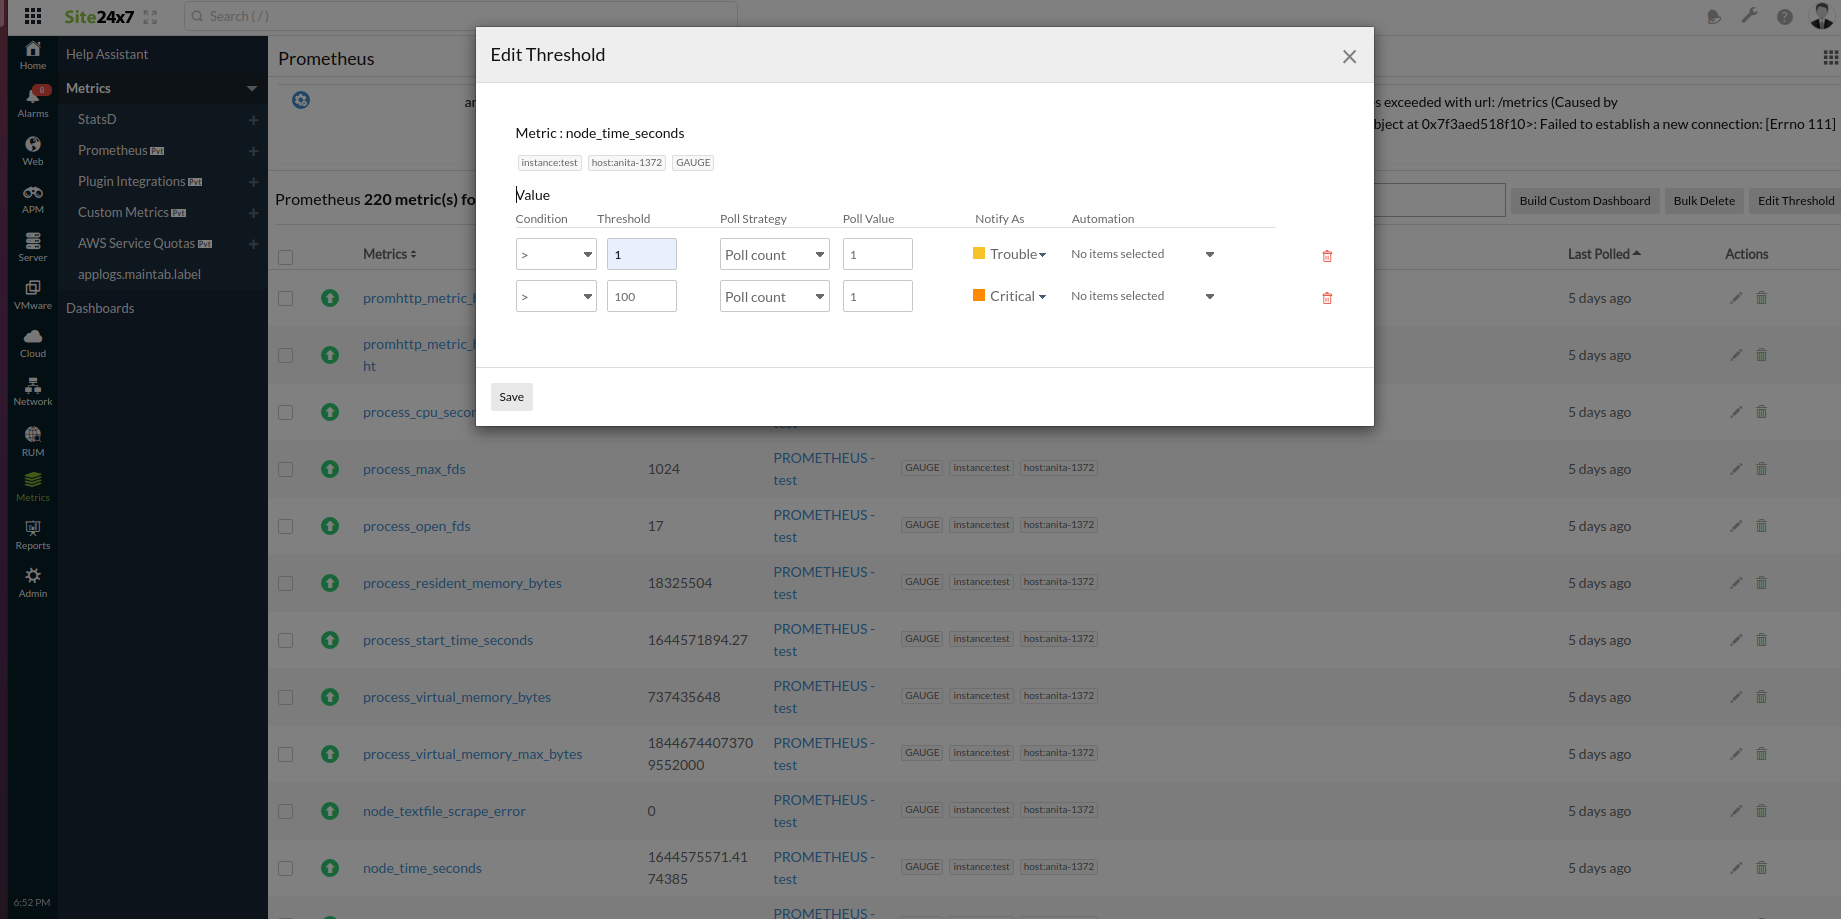
You can set thresholds for each metric pushed to Site24x7 and receive alerts when they breach the configured threshold value. To set a threshold for a particular metric,
- In the Site24x7 web client, go to Metrics > Prometheus.
- In the Action column, click on the pencil icon beside the metric that you want to set threshold.
- Enter the Threshold value, and set the appropriate Condition (<, <=, >, >=, =), the Poll Strategy, and the type of alert that you wish to receive (Trouble or Critical). You can also utilize Automation to automatically remediate the issue when there is a breach.
- Save your changes.

Bulk Action: You can also set thresholds for multiple metrics at the same time. To do this, select the metrics that you wish to associate thresholds and click Edit Threshold. If you want the same threshold configuration to be applied for all the selected metrics, enable the checkbox—Apply to all instances—to prefill all the selected metrics with the threshold details of the first metric.
Edit monitor details
You can set user group preferences and edit notification settings on the Edit Monitor Details page.
- Go to Home and go to the Prometheus monitor listed and hover on the hamburger icon
 beside the monitor name. Click Edit.
 - In the Edit Monitor Details page, you can select your Notification Profiles, User Alert Groups, set IT Automation and use Third-Party Integrations if needed.
- Save your changes.
Build your custom dashboard
You can create and customize your dashboard and view all the metrics in a single dashboard using custom dashboards. Once the agent is successfully integrated, a default dashboard will be listed under Metrics > Dashboard > Prometheus - Default Dashboard. To create a new one,
- In the Site24x7 web client, go to Metrics > Prometheus.
- Select the metrics that you would like to add to the dashboard.
- Click on the Build Custom Dashboard tab.
- Provide a Dashboard Name and Save your changes.
This would open the customized dashboard in a new tab. You can choose to add and remove metrics using the Edit Dashboard option and share it as a PDF or permalink using the Share This option. All the dashboards created will be listed under Metrics > Dashboards.
All these metrics will be listed under their respective server monitors in the Custom Dashboards page.
Reports
You can fetch the time-specific reports on an hourly, daily, weekly, and monthly-basis from the Reports section on the left pane. Get a detailed list of the Health Trends, Metrics Status, and Inventory reports of each service and application. You can also opt to obtain the Availability Summary, Outage History, and Performance reports on the metric level from this section.
Licensing
Each account includes, for free, up to 500 metrics without threshold checks. Beyond that, every 10 metrics (with or without threshold checks) will be considered as one basic monitor. For example,
500 metrics without threshold checks = free
500 metrics with 100 threshold checks = 10 basic monitors
1,000 metrics with 500 threshold checks = 50 basic monitors
Initially, you can add up to 1,000 metrics. To add more, please reach out to support@site24x7.com.
-
On this page
- How it works
- Prerequisites
- Command-line integration for a new Site24x7 server monitoring agent
- Command-line integration if the agent is already installed
- Manual integration
- Sample configuration
- Performance metrics
- Set thresholds
- Edit monitor details
- Build your custom dashboard
- Reports
- Licensing
