Step Summary Report
Step Summary Report gives you richer detail about the step-wise availability percentage and response time data (in seconds) of your individual steps in your Web Application (Real Browser Monitor). If you've Real Browser Monitors in your Monitor Groups, you can generate Step Summary Report for all Real Browser Monitors in that group. You have to simply sort the Monitor Group while generating the Step Summary Report. You'll be able to generate a By Day and Overall report based on the Time period chosen by you.
Generate Step Summary Report
- Log in to Site24x7 client.
- Navigate to Reports >Monitor Groups > Step Summary Report.
- Select the required Monitor Group from the header drop-down and change the listed parameters to view your step summary report.
- Monitor Groups: Select the Monitor Group for which the report needs to be generated. The report will only capture the availability percentage and average response data of all the Web Application (Real Browser) Monitors in your specified Monitor Group. It'll not consider the performance stats of any other monitors present in that group.
- Time Period: Choose the required time period for which the report needs to be generated.
Note
You can generate reports for time periods ranging from last 1, 6, 12, 24 hours, today, yesterday, This week (Sunday-Today), Last week (Sun-Sat), Last 7 days, This month, Last Month, Last 30 days, and This year. You can also select a custom date range to create the report.
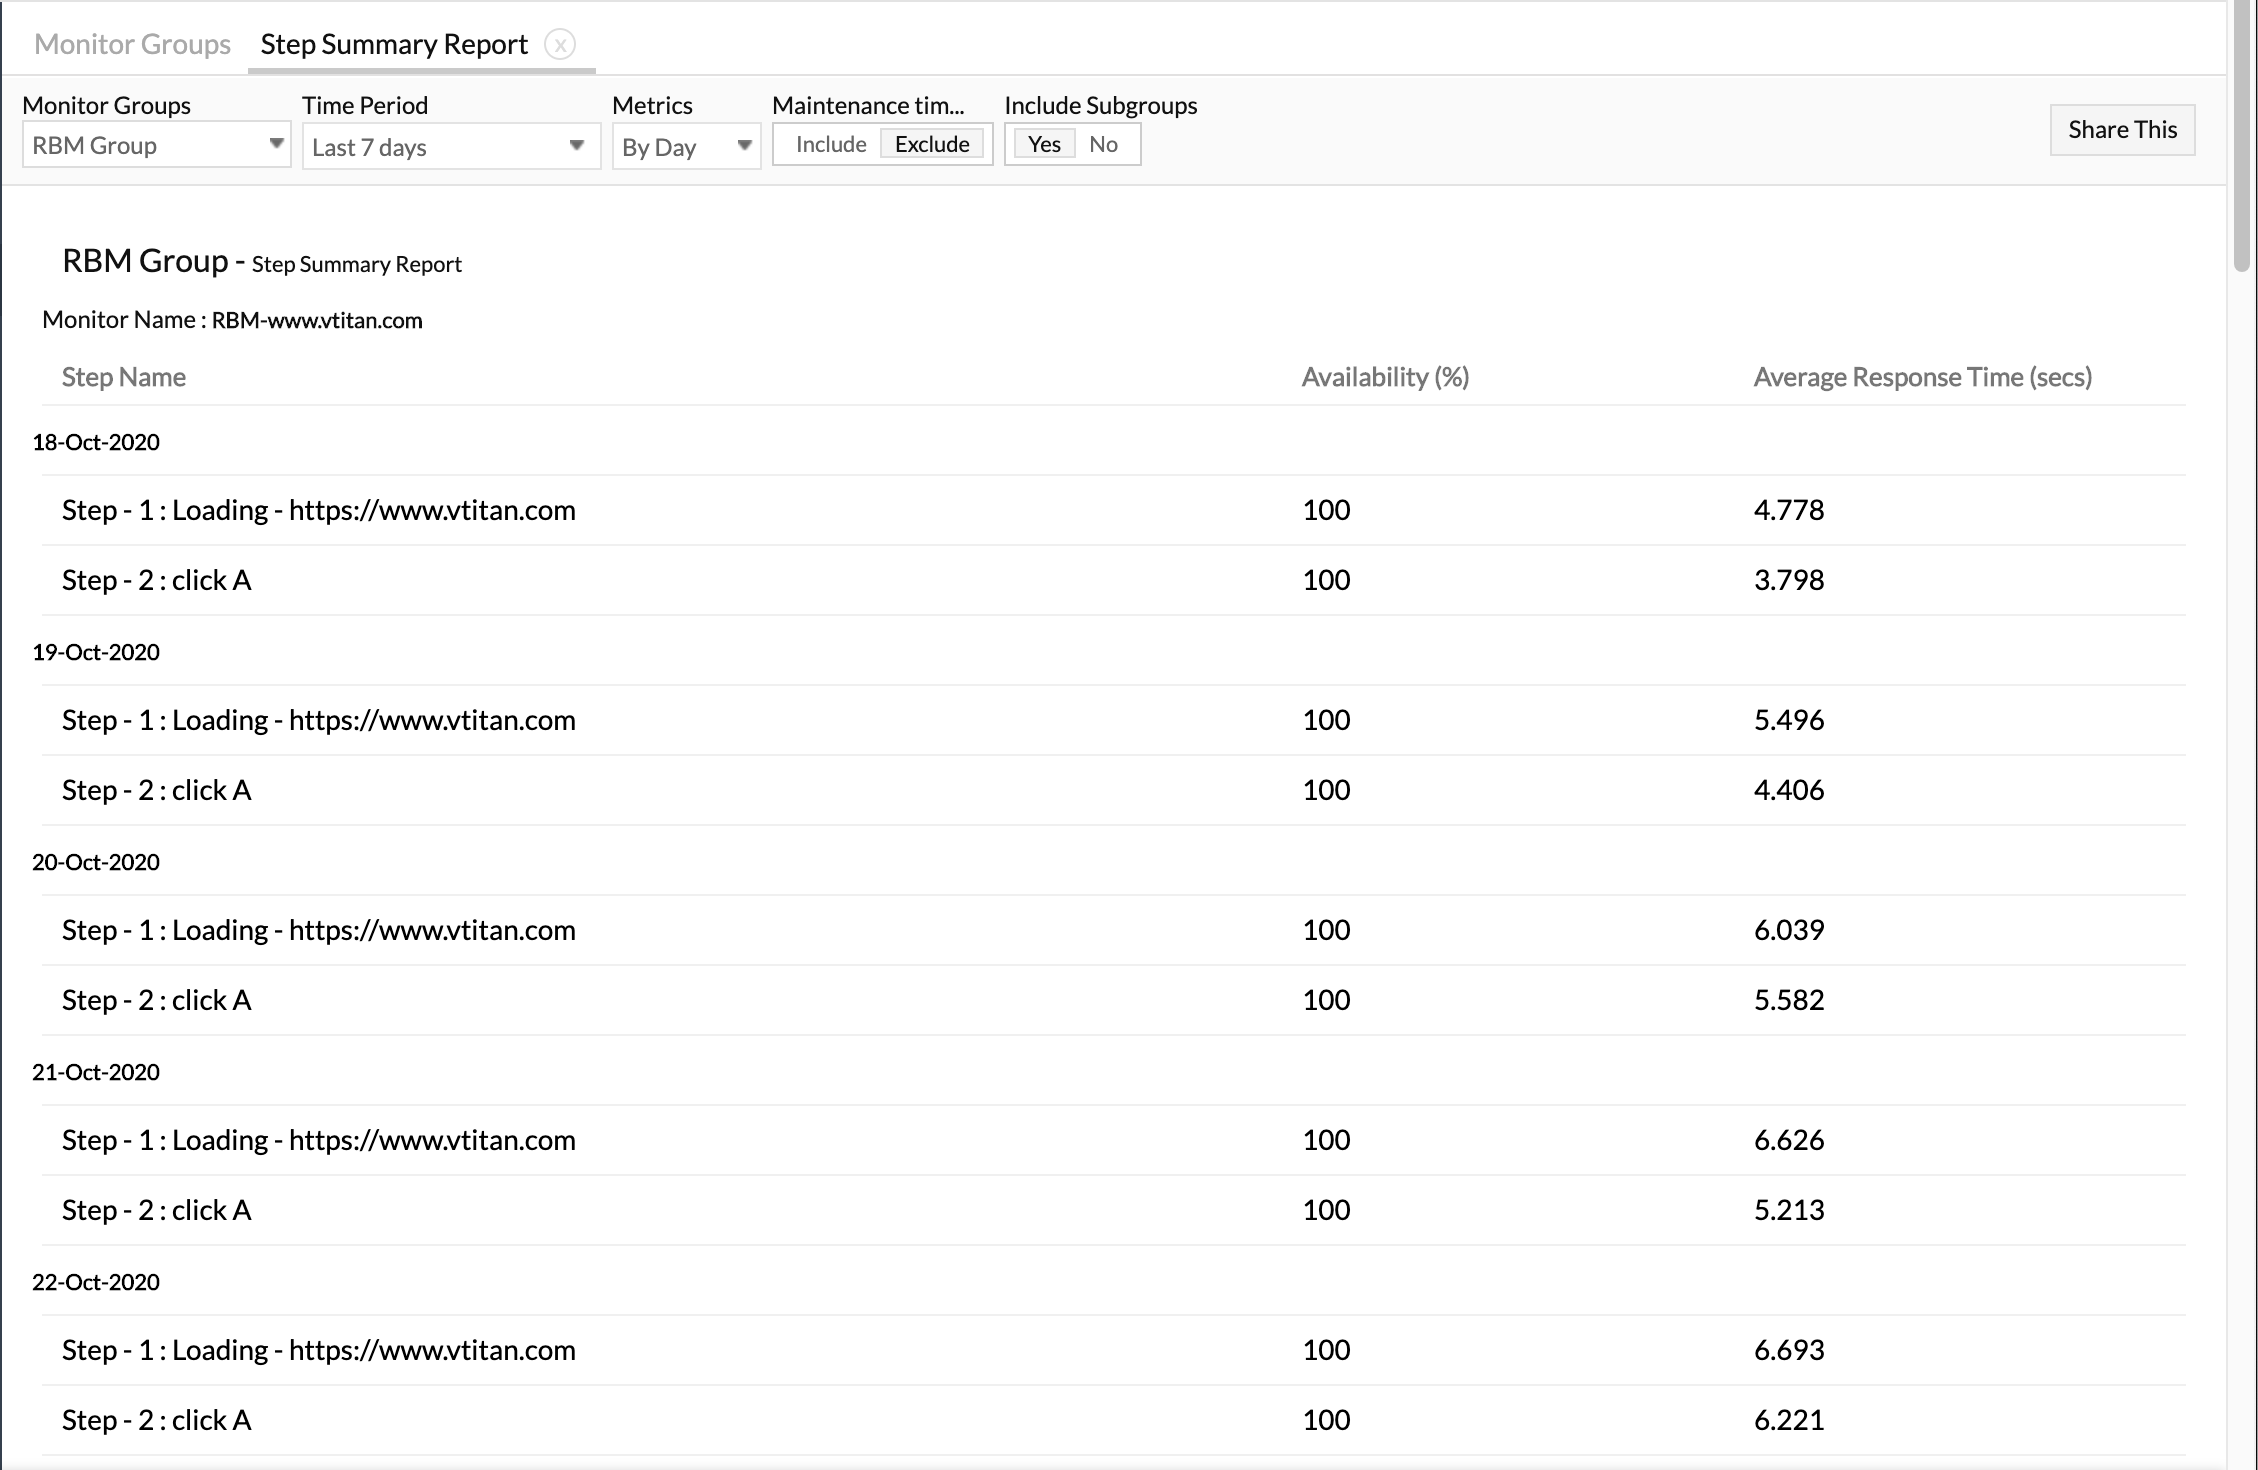
- Data - By Day: You can generate a By Day report if you've selected a time range from among (This week (Sunday-Today), Last week (Sun-Sat), Last 7 days, This month, Last Month, or Last 30 days). A By Day report gives the availability % and average response time (seconds) values of the individual transactions during every single day in your specified time range.
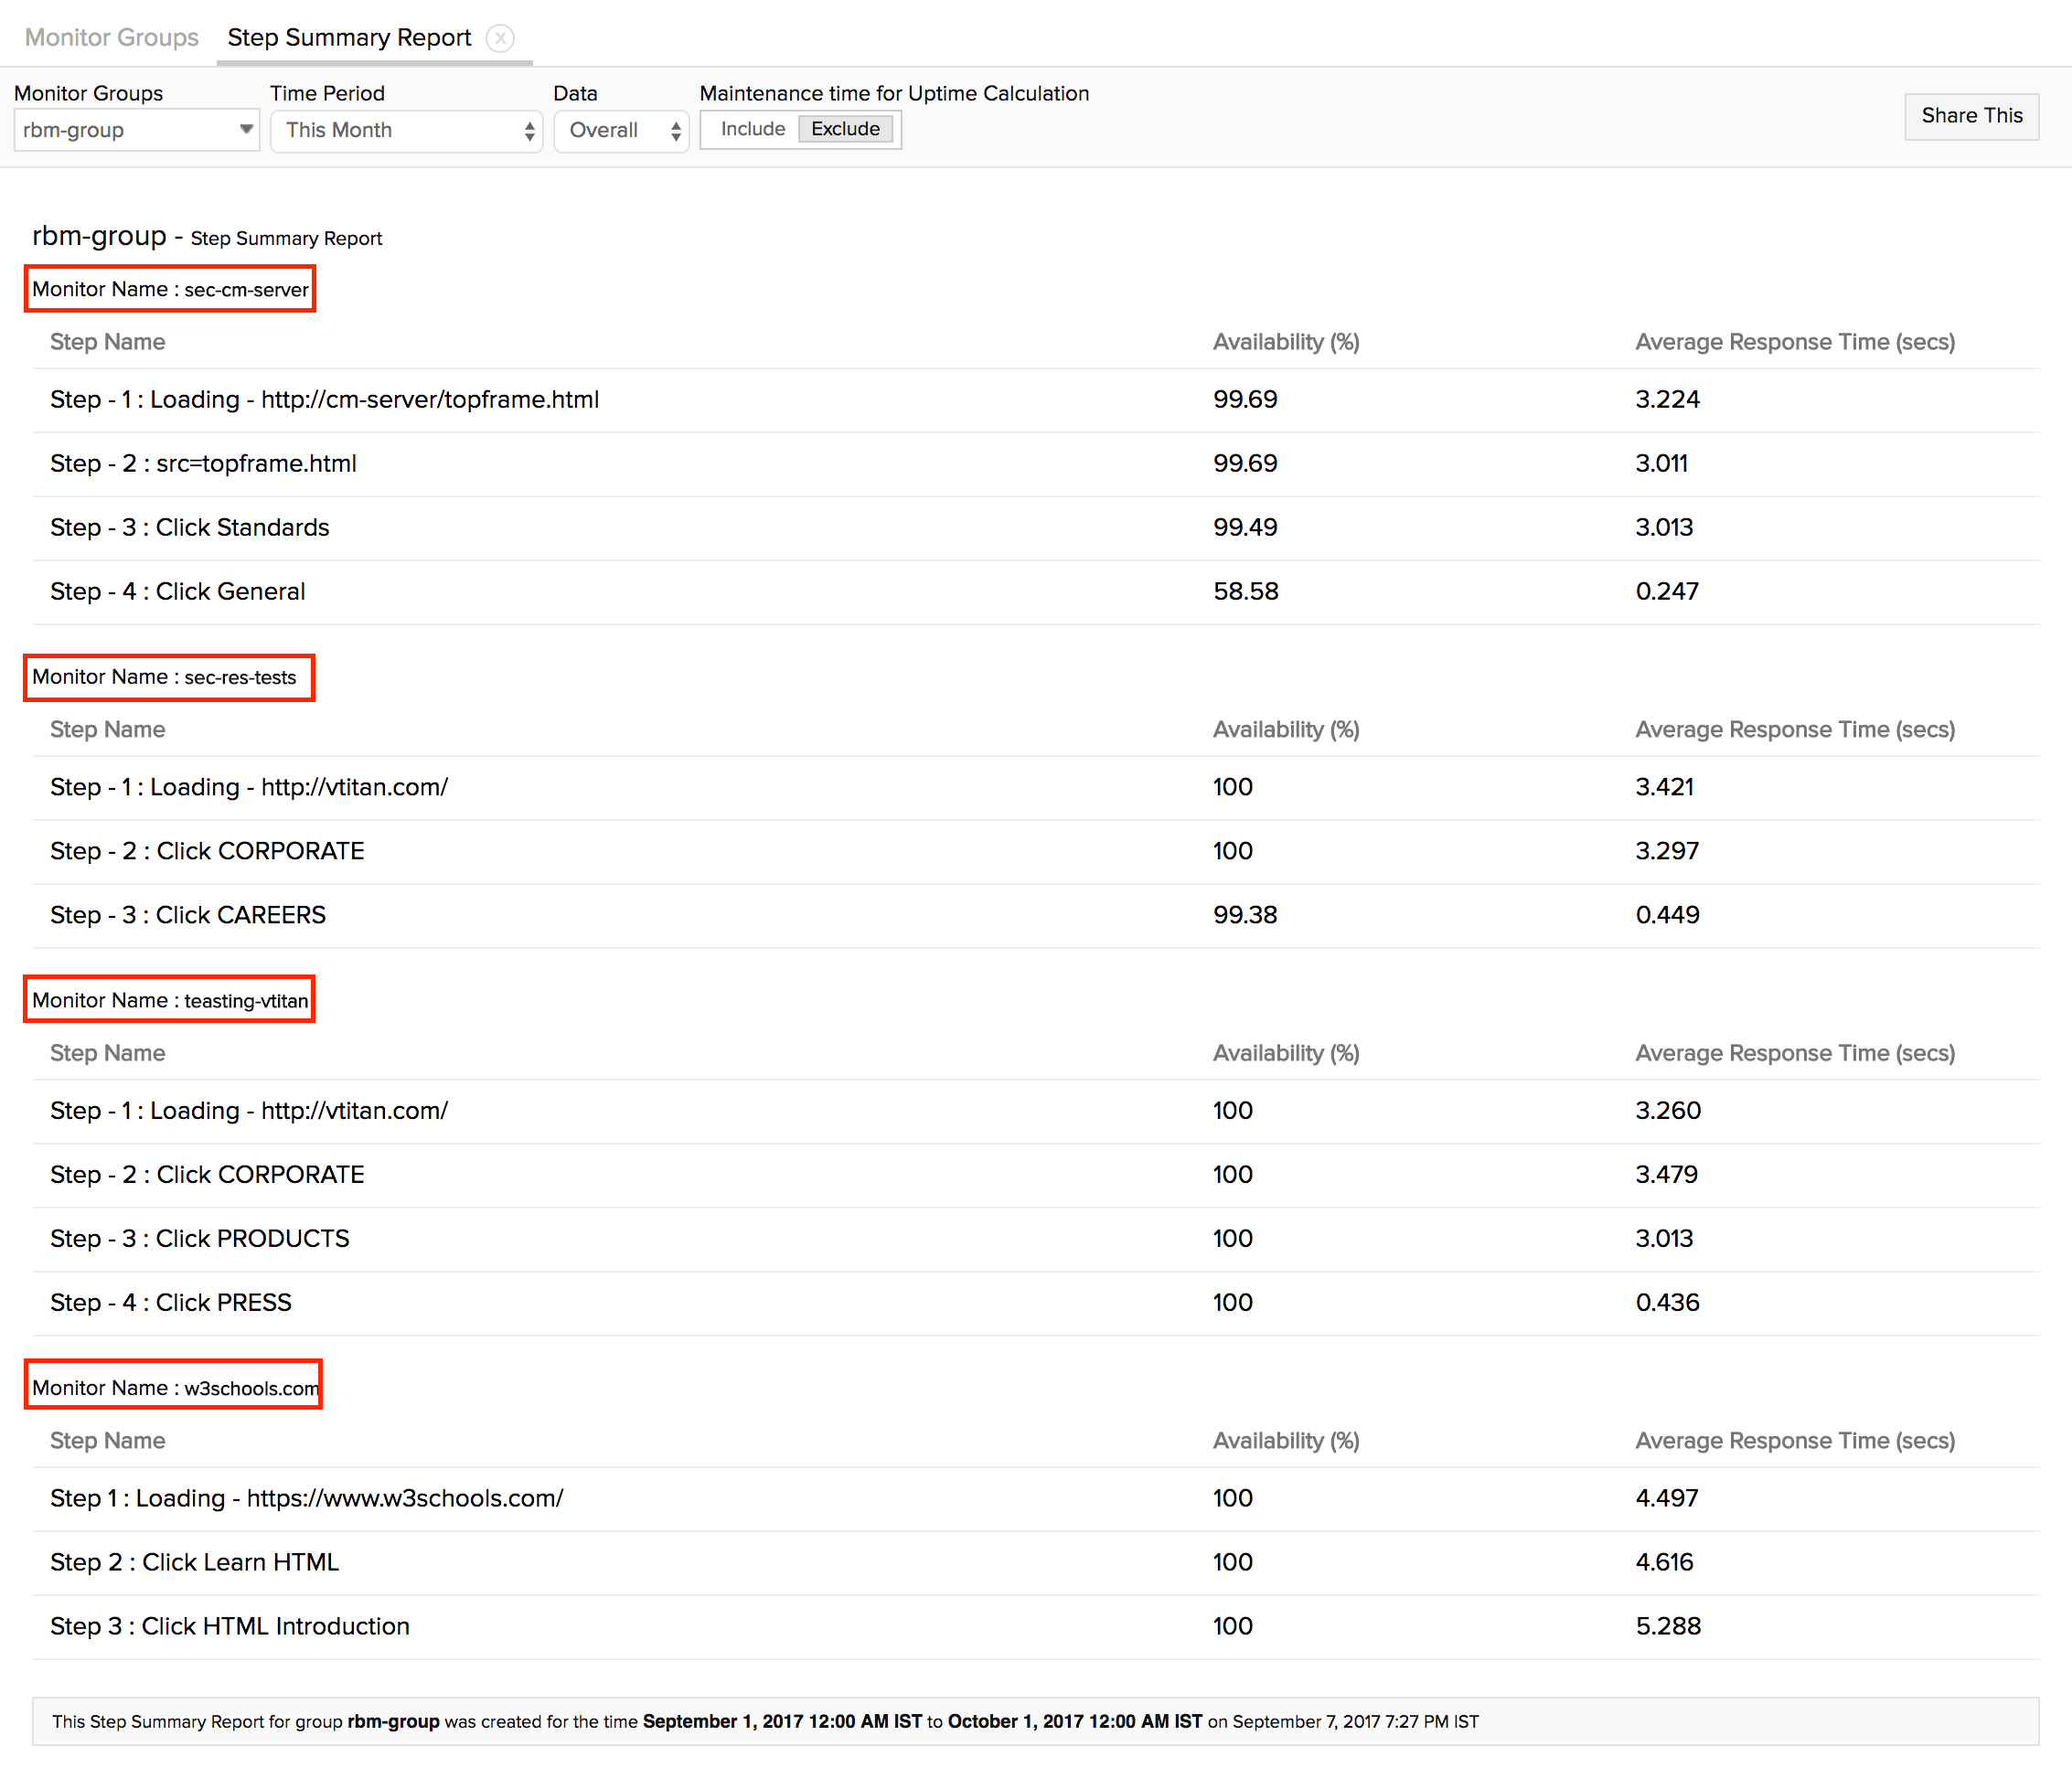
- Data - Overall: You can generate an Overall report if you've selected a time range from among (last 24 hours, today, yesterday, This week (Sunday-Today), Last week (Sun-Sat), Last 7 days, This month, Last Month, Last 30 days, This year or Custom Period). An Overall report gives the consolidated availability % and average response time (seconds) values of the individual transactions for your specified time.
- Maintenance time for Uptime Calculation: You can include / exclude maintenance time of the monitors in the Monitor Group for uptime calculation.
- Include Subgroups: Enable this option to include subgroups of the selected Monitor Groups. Otherwise, only the selected Group will be considered.
- Once the report is generated, click "Share This" button on the top right corner.
- Publish Report: Click publish report and populate the form. This creates a permalink that would make the report accessible to customers without a login. If you've chosen a custom date range in time period, you'll not find this option listed in the drop-down menu.
- Export CSV: Export the report as a CSV file.
- Export PDF: Export the report as a PDF file.
- Email: Share the report via an email. Email can be sent to only those verified users who have agreed to receive emails from Site24x7.
- Schedule Report: Populate the schedule report form, to create a report task that would trigger step summary report emails to your alert groups.
By Daily Break up
Get a segmented daily break up view of the availability % and average response time (in seconds) of your transaction steps for all Web Application (Real Browser) Monitors in the Monitor Group. If a specific transaction step fails to execute during the recorded simulation, the monitor will fail and subsequent steps will not be executed. This will be captured in step summary report with no availability and response time data recorded for these steps. On failure, a subsequent step will have the same availability percentage as the failed step, with the response time value shown as "-".

Overall Break up
Get the total availability percentage and average response time (seconds) data for all your monitored web application (real browser) monitors in your specified Monitor Group, during the selected time period. Again, like in the Daily break up view, if a specific transaction step fails to execute during the recorded simulation, the monitor will also fail. All subsequent steps will stop execution. These will be captured in step summary report for individual Web Application (Real Browser) monitors separately, with no availability and response time data recorded for these steps. On failure of a specific step in the monitor, the subsequent steps will also have the same availability percentage as the failed steps, with the response time value shown as "-".

Calculating Availability % and Average Response Time (in seconds)
Before discussing about the formulas used to decipher Availability % and Average Response Time stats of your specified Monitor in the Monitor Group, you must know about some other critical factors, which are taken into account for this calculation. They are:
- Down Time: The total amount of time during which the monitor is in DOWN status
- Maintenance Time: The total time period within the Monitoring Period for which the monitor is marked as under MAINTENANCE
- Response Time: The time taken to complete a single poll
- Down Percentage: The percentage of time that the monitor is down outside of the Maintenance Period.
- Maintenance Percentage: The percentage of time the monitor is under maintenance.
Availability Percentage, when Maintenance is included:
Availabilty Percentage= 100 - (Down Percentage + Maintenance Percentage)
Availability Percentage, when Maintenance is excluded:
Availabilty Percentage= 100 - Down Percentage
Average Response Time:
Cumulative sum of all data collection response times during a specified period divided by the total number of data collections during the period.
