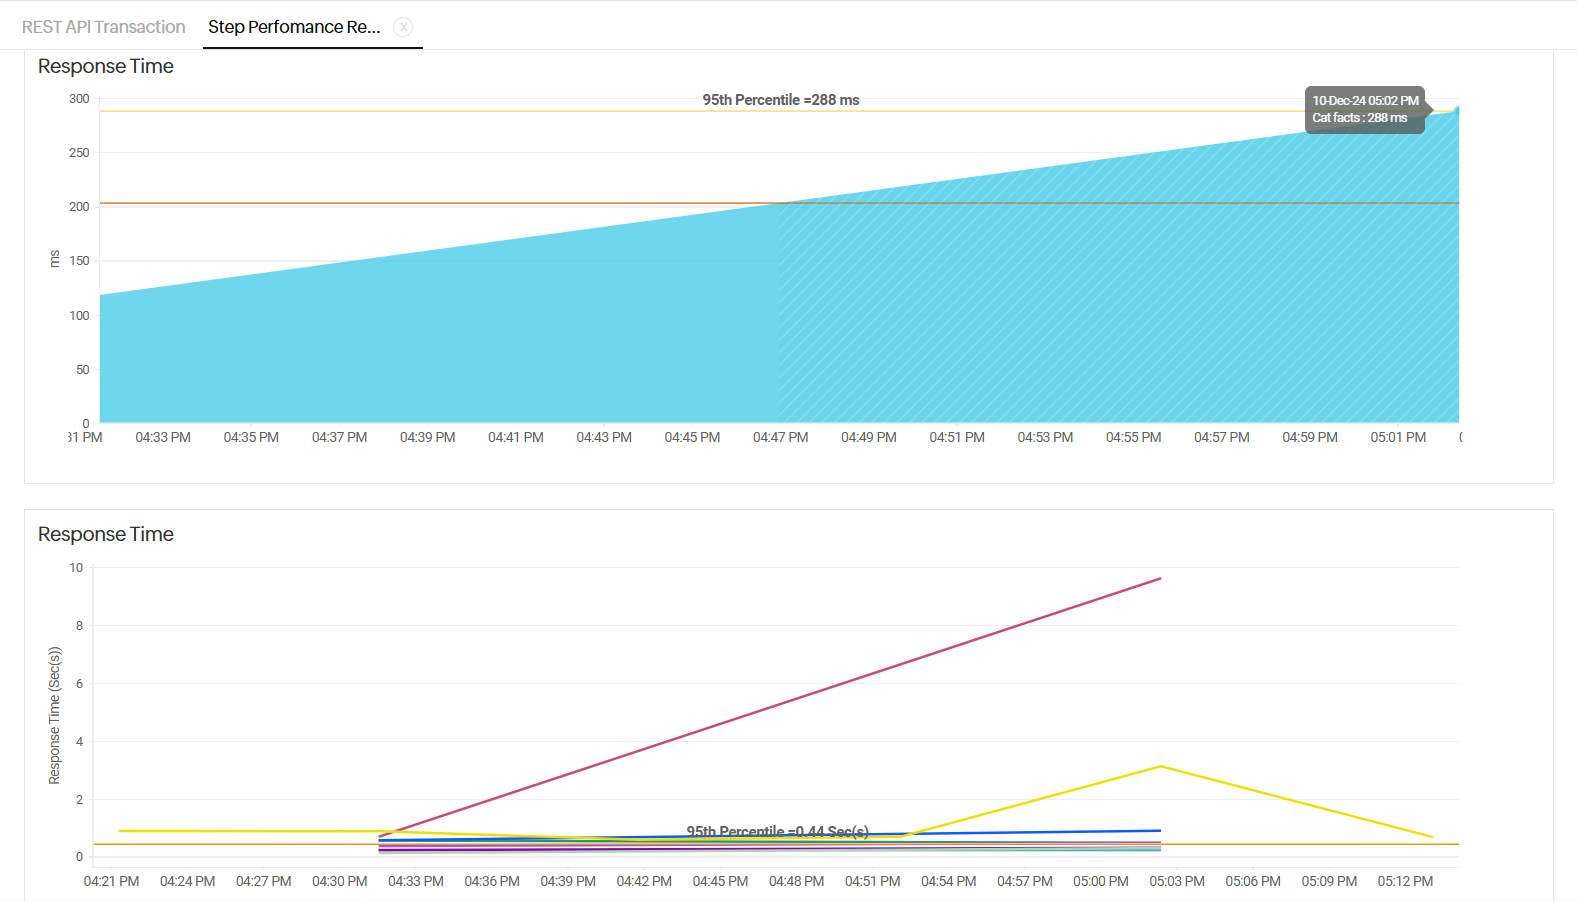
Step Performance Report
The Step Performance Report offers detailed information on the step time and response time of a configured monitor from a monitoring location for a selected step. It helps you analyze performance for each step based on location-specific data. This report also helps you identify Web Transaction (Browser) and REST API Transaction monitors with step-wise business-critical transactions, enabling you to take corrective measures whenever necessary.
Supported monitor types
This report is supported for the Web Transaction (Browser), Synthetic Mobile Application, and REST API Transaction monitors.
Generate Step Performance Reports
- Log in to your Site24x7 account.
- Navigate to Reports > Web Transaction (Browser) or REST API Transaction or Synthetic Mobile Application > Step Performance Report.
- Select the required monitor from the header drop-down and change the listed parameters to view a customized report:
- Monitor: Select the desired monitor from the drop-down.
- Step Name: Select the preferred step name for the selected monitor from the drop-down.
- Time Period: Choose the required time period for which the report needs to be generated.
NoteYou can generate reports for time periods from the last one, six, 12, or 24 hours as well as any custom date range for the previous year.
- Unit of Time: Select the desired unit of time.
NoteLearn more about the granularity supported for each time period.
- Business Hours: Select the time period that is most critical to your business.
- Locations: Select the preferred location or On-Premise Poller agent from which you want to get the report.
- Attribute: Select the attribute for your report. Step Time provides the time taken by the step, and Page Load Time provides the time taken by the page to load.
NoteThe attribute is applicable only for Web Transaction (Browser) monitors.
- Once the report is generated, click the Share This button in the top-right corner.
- Export CSV: Export the report as a CSV file.
- Export PDF: Export the report as a PDF file.
- Email: Share the report via email. Emails can be sent to only those verified users who have agreed to receive emails from Site24x7.
Interpret performance reports
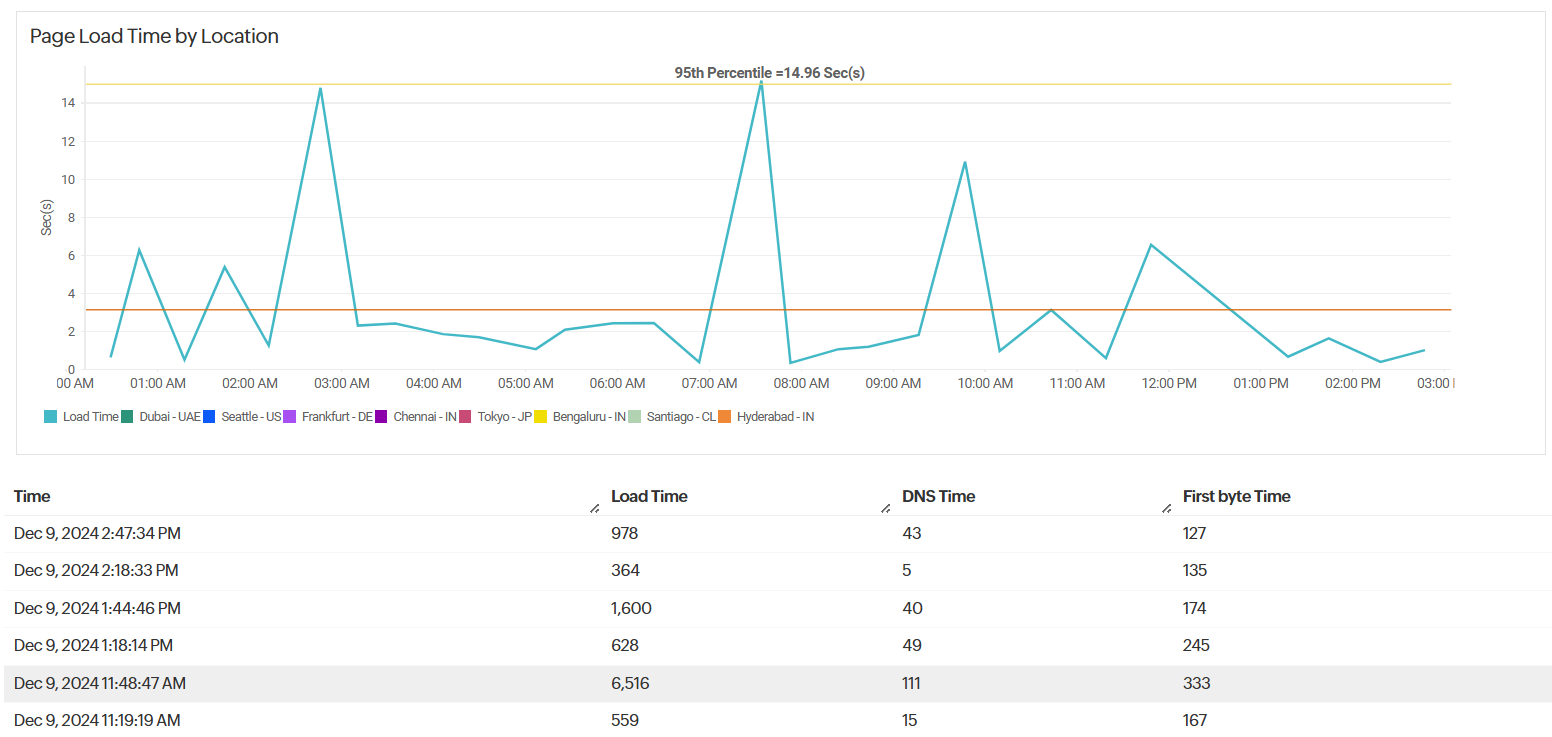
Based on the type of monitor, you can view and analyze the various step performance trends of the selected monitor. The information will be displayed in both graphical and tabular views.
Attribute-level reports
For the Web Transaction (Browser) and Synthetic Mobile Application monitors
- Step Time: Selecting this attribute generates a report based on the step time and its corresponding location. In addition to the step time, the report includes a graph based on the location and a tabular list displaying metrics such as the Time (the date and time), Step Time (ms), Page Load Time (ms), DNS Time (ms), and First Byte Time (ms).
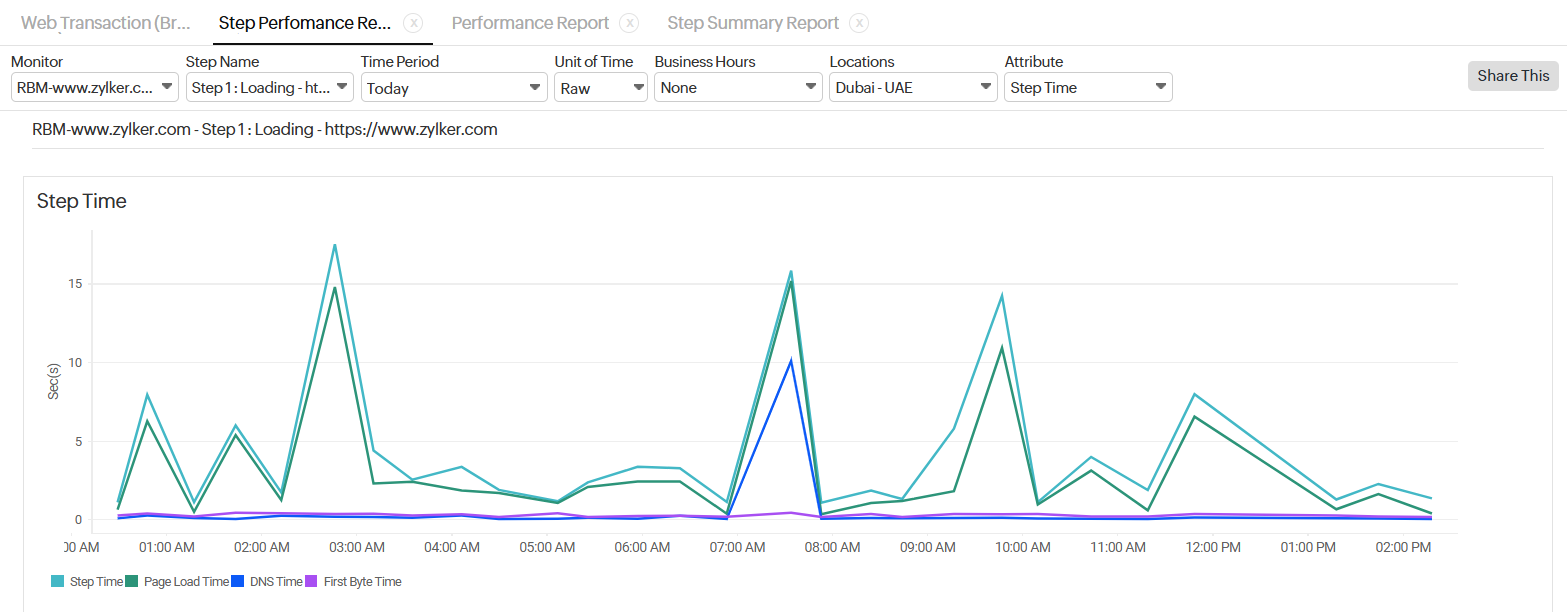
Metric
Description
Step Time
The time taken by the selected step over a time period
Page Load Time
The total time taken to load the HTML and all its associated components, including JavaScript and images, for an individual step in the transaction
DNS Time
The time taken by a domain name server to receive the request for receiving the IP address of a domain name, process it, and return the IP address to the browser
First Byte Time
The time it takes for a browser to receive the first byte of a response after sending a request to the server
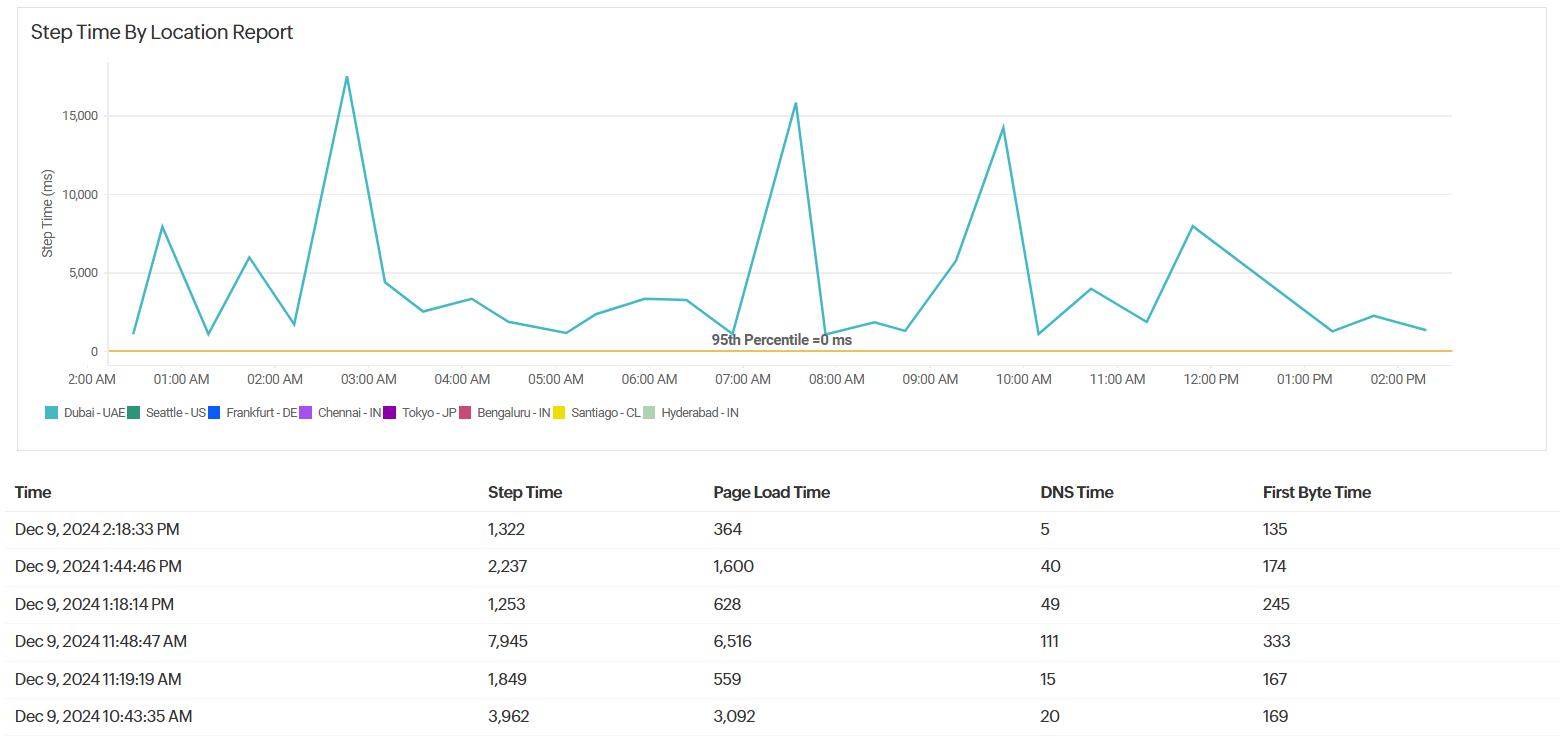
- Page Load Time: Selecting this attribute generates a report based on the load time and its corresponding location. In addition to the step time, the report includes a graph based on the location and a tabular list displaying metrics such as the Time (the date and time), Load Time (ms), DNS Time (ms), and First Byte Time (ms).
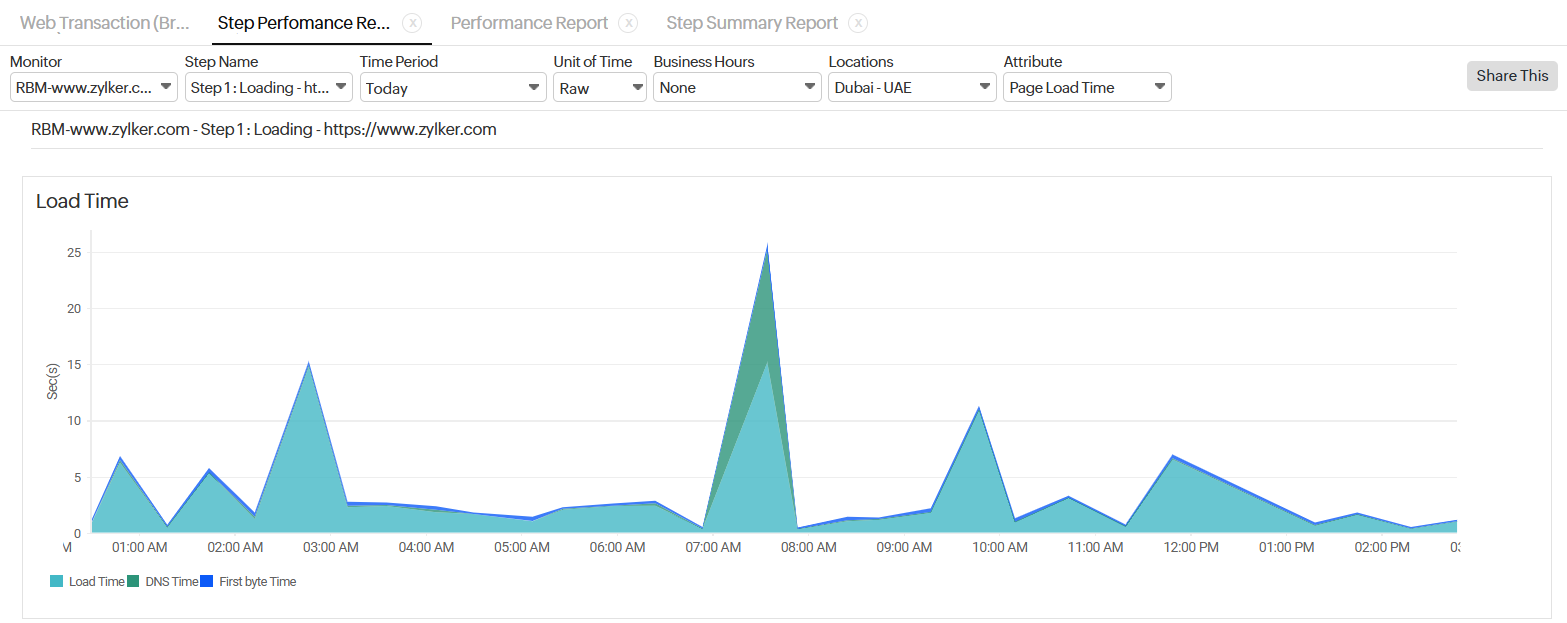
Metric
Description
Load Time
The time taken by the step to load
DNS Time
The time taken to receive the resolved IP address from the DNS server
First byte Time
The time taken from establishing a connection with the server until the first byte of the base page response is received
Interpreting graphs
For REST API Transaction monitors
- Response Time: You can obtain detailed information on the response time of your configured REST API Transaction monitor for a selected location by hovering the cursor over the designated area in the graph.
