Reflecting on a year of smarter network monitoring: 2025
This year, the world leaned heavily on words like reimagine, rebuild, renew, reshape, and reinvent, and the same spirit defined our journey. As promised last year, we reimagined key capabilities, reshaped workflows, and restructured critical parts of our network monitoring tool to meet modern demands. At the same time, we reinforced the core foundation you've trusted for more than a decade: delivering reliable, usable features with uncompromising security.
As networks grow more distributed, data-heavy, and cloud-driven, the expectations around visibility and control continue to rise. Our focus this year was simple: Make network monitoring more accurate, more intuitive, and more complete while ensuring every enhancement delivered measurable operational value.
Recognition driven by customer trust
That focus was reinforced by customer feedback throughout the year. In recognition of customer trust in our network management solutions, ManageEngine was named a Customers’ Choice in the 2025 Gartner Peer Insights™ Voice of the Customer for Network Management Tools, reflecting strong user satisfaction and real-world feedback from verified reviewers. This distinction highlights the value customers see in comprehensive capabilities that help maintain resilient, high-performing networks; underscores our commitment to supporting IT teams; and validates our continued emphasis on reliability and practical usability.
This year brought meaningful improvements across availability and performance monitoring, traffic analysis, configuration management, SDN and SD-WAN monitoring, and more. Let’s take a look at how we strengthened our monitoring capabilities.
Network availability and performance
Keeping your network stable starts with clear visibility. This year, we introduced capabilities that reimagined the way you can discover networks for monitoring and delivered deeper insights into devices already under management.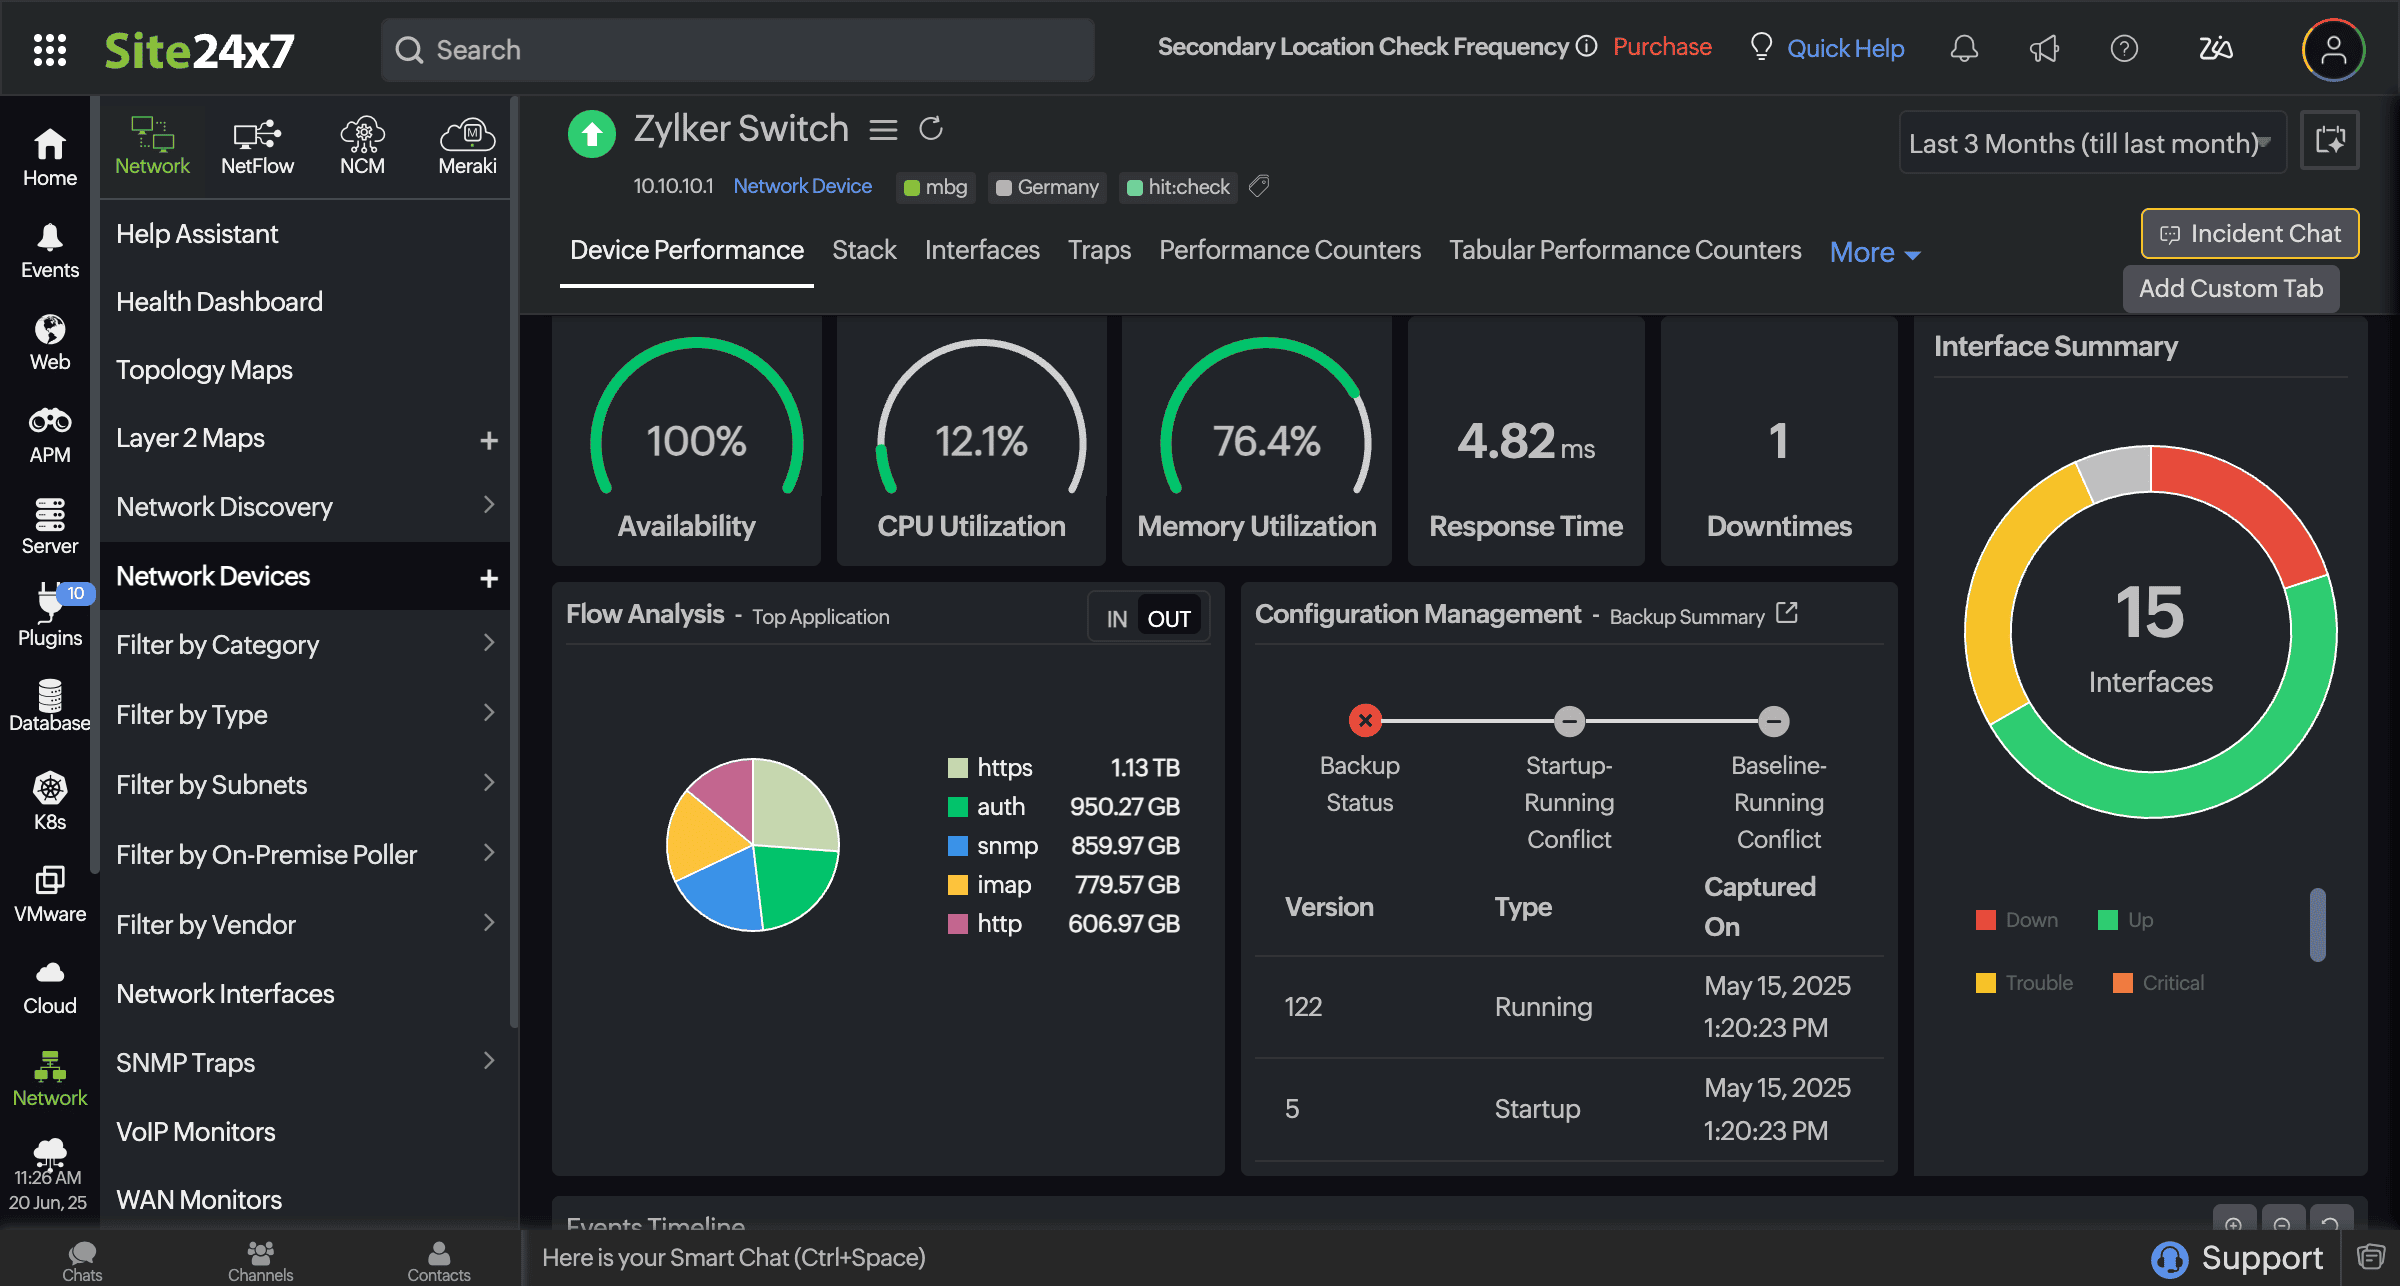
Reimagining network discovery and discovery reports
Reducing the time taken to discover networks was a key priority. To address this, we introduced a single-page network discovery process that enables you to start monitoring devices and networks for availability, performance, traffic, and configuration at once. You can also run the same profile across multiple networks, so you don't have to redo discovery across multiple sites. Clone the same profile, schedule it, and initiate discovery easily. Once Site24x7 finishes network discovery, you can view detailed reports to identify new, missing, or unclassified devices.
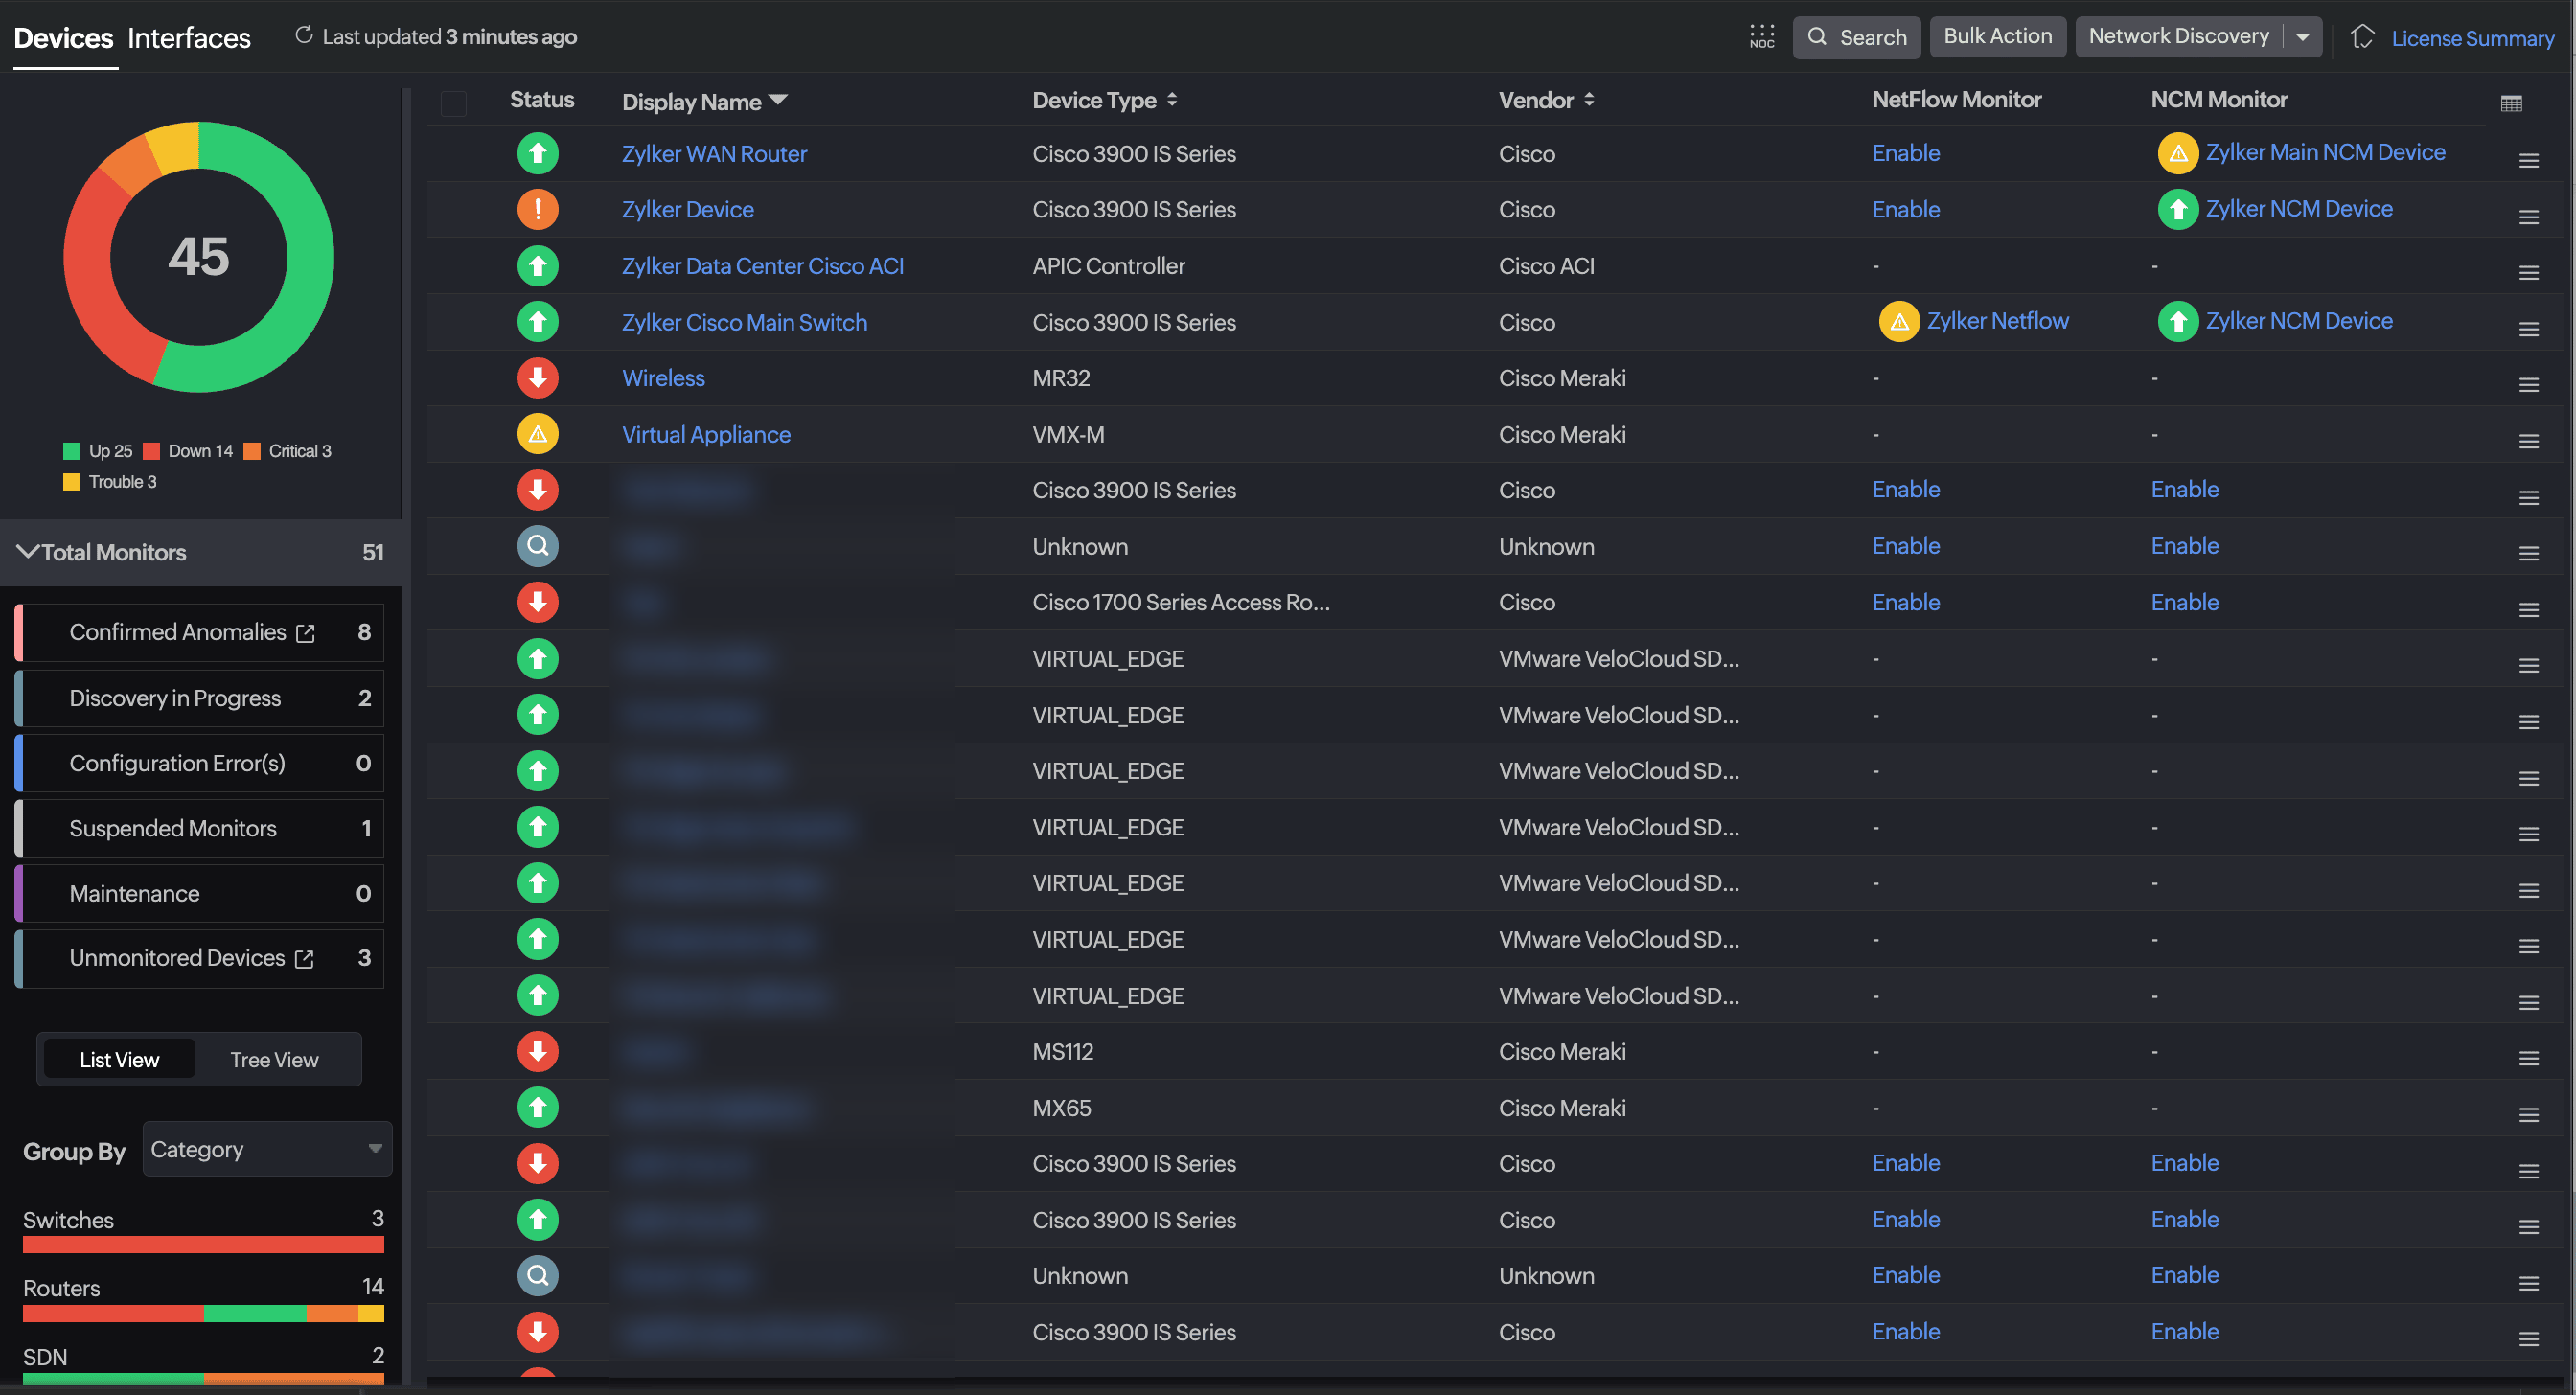
Reinvented the Network Inventory page
Reorienting your sprawling network into a list might sound daunting, but clarity matters at scale. As soon as you add monitors, you get a centralized view of all discovered devices and interfaces , making it easier to maintain an accurate and up-to-date picture of your environment.
Reoptimized views for hardware health visibility
Refine your hardware monitoring by tracking temperature, fan speeds, and power supply status. This enables earlier detection of degradation and more proactive outage prevention.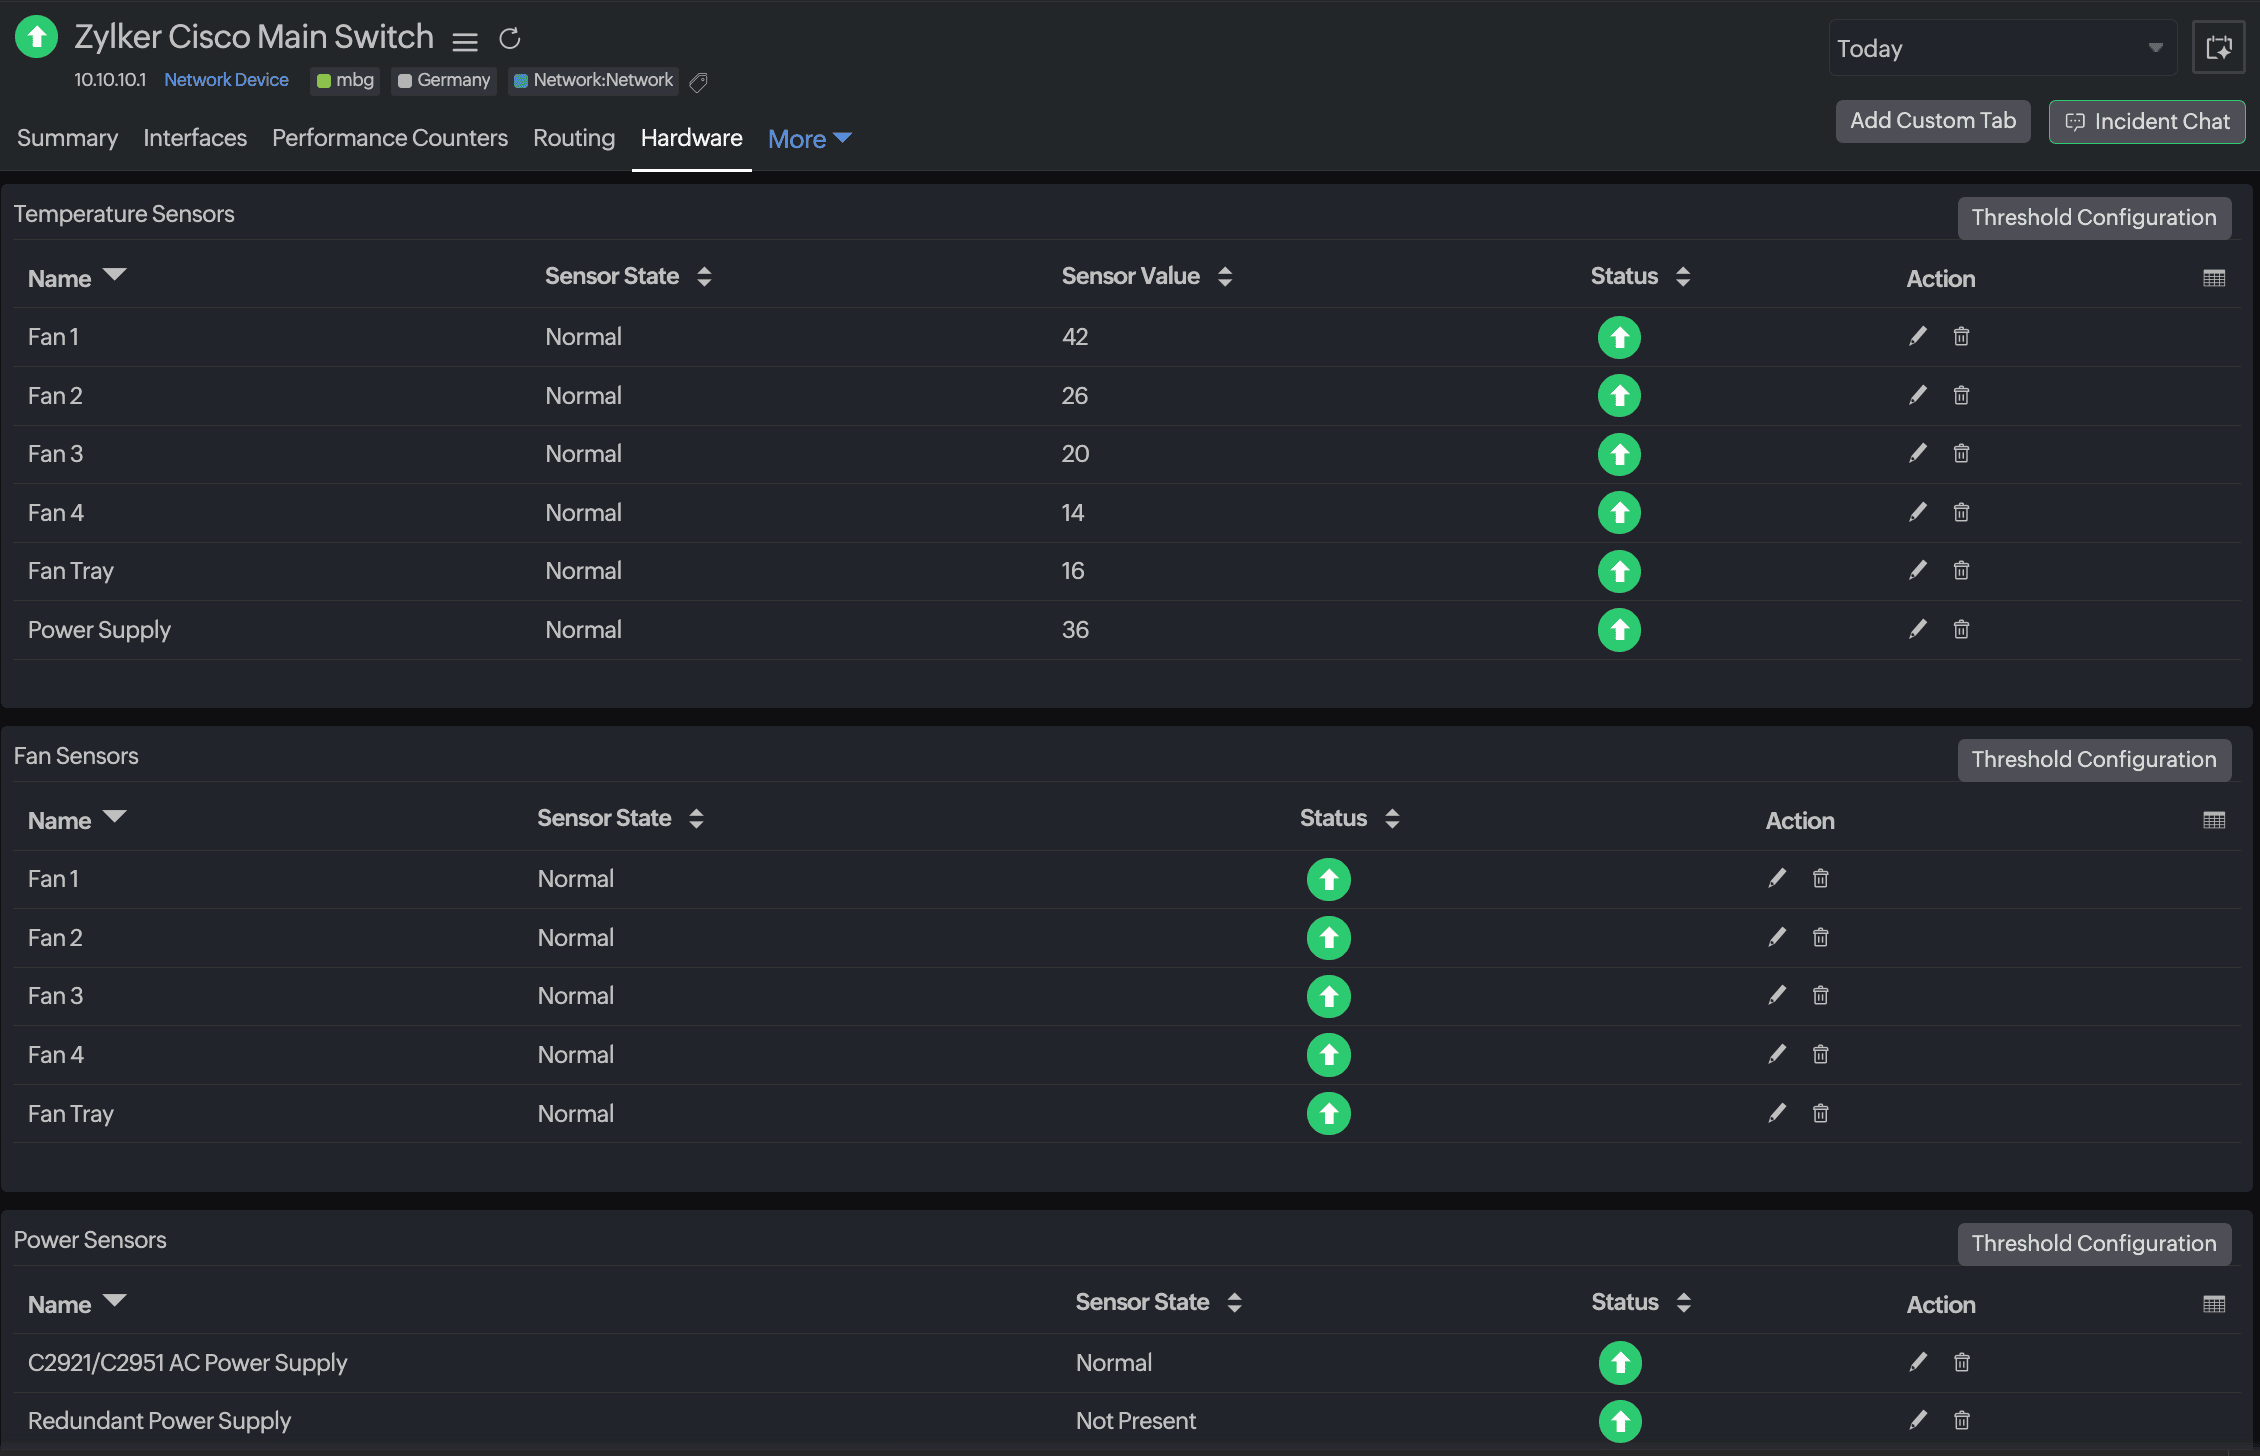
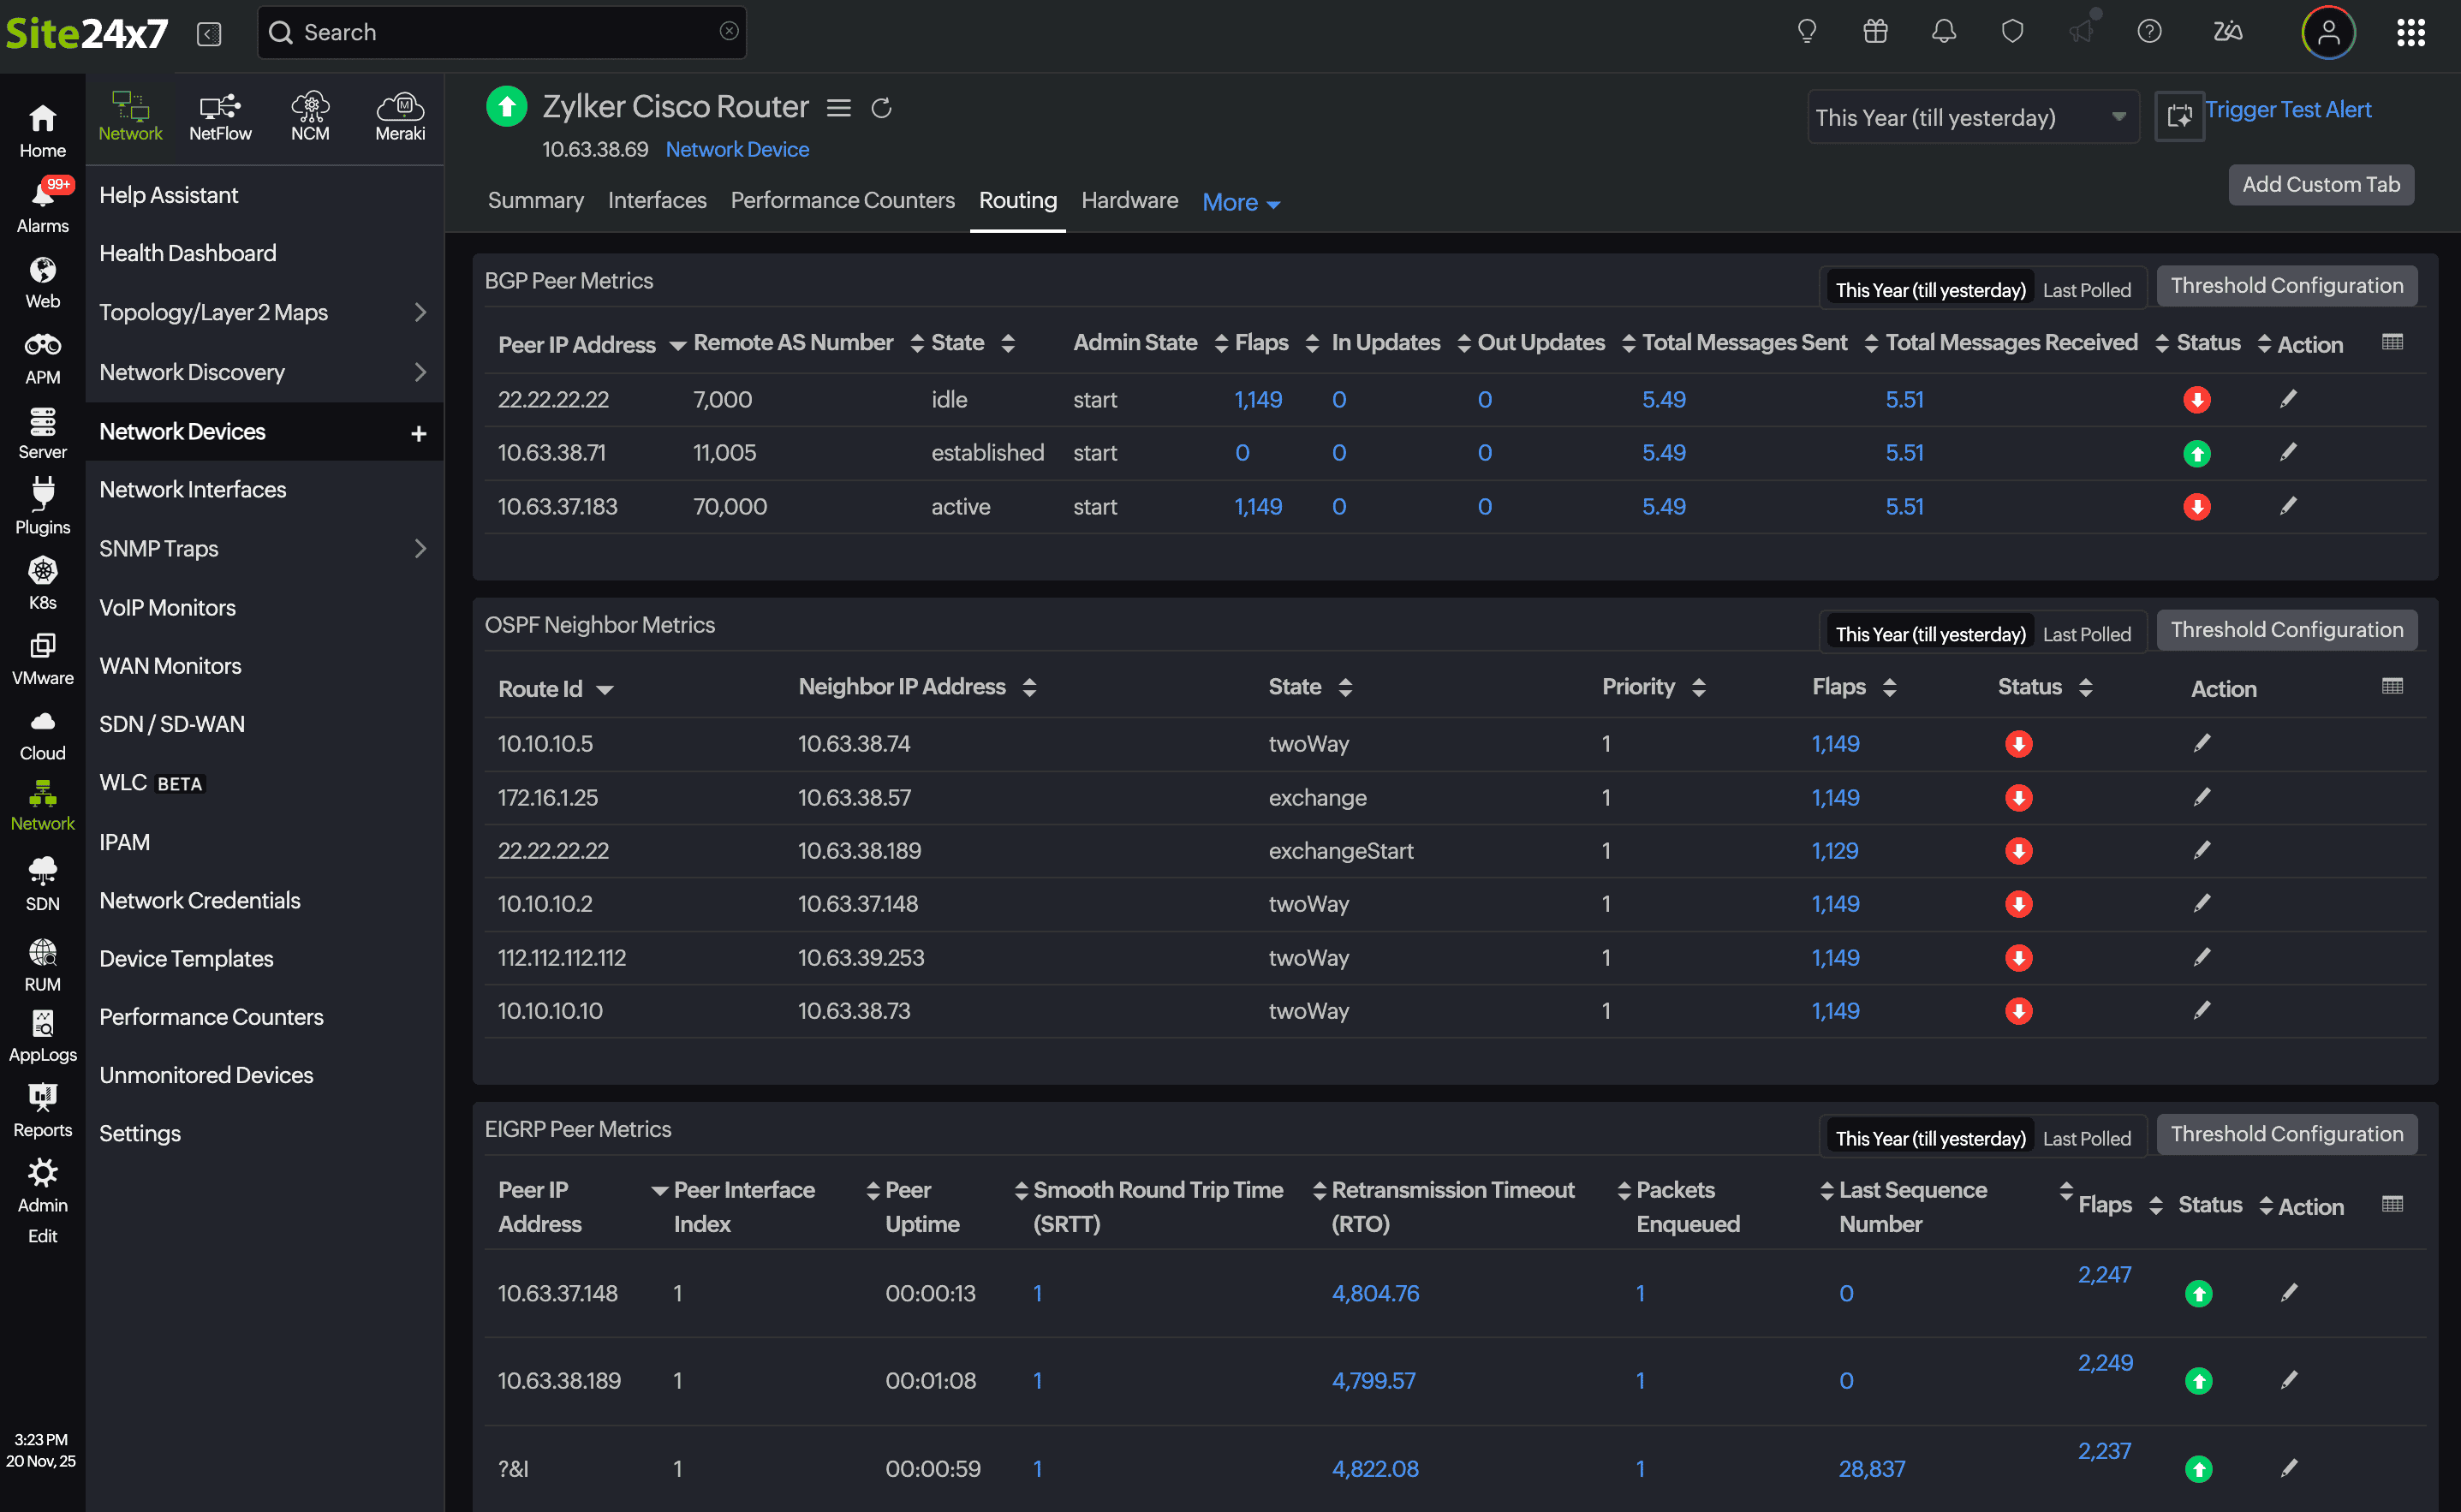
Refined router performance monitoring
Recognizing the need for deeper visibility into router performance, we expanded support for real-time insights into routing protocols such as BGP, OSPF, and EIGRP. You can now view protocol-specific metrics across all supported routers, making routing behavior easier to analyze and troubleshoot.
Reflecting VPN tunnel status and performance data in real time
Reliable, secure, and stable site-to-site connectivity is critical for modern organizations. To support this, Site24x7 now provides real-time visibility into firewall VPN tunnel status and performance.
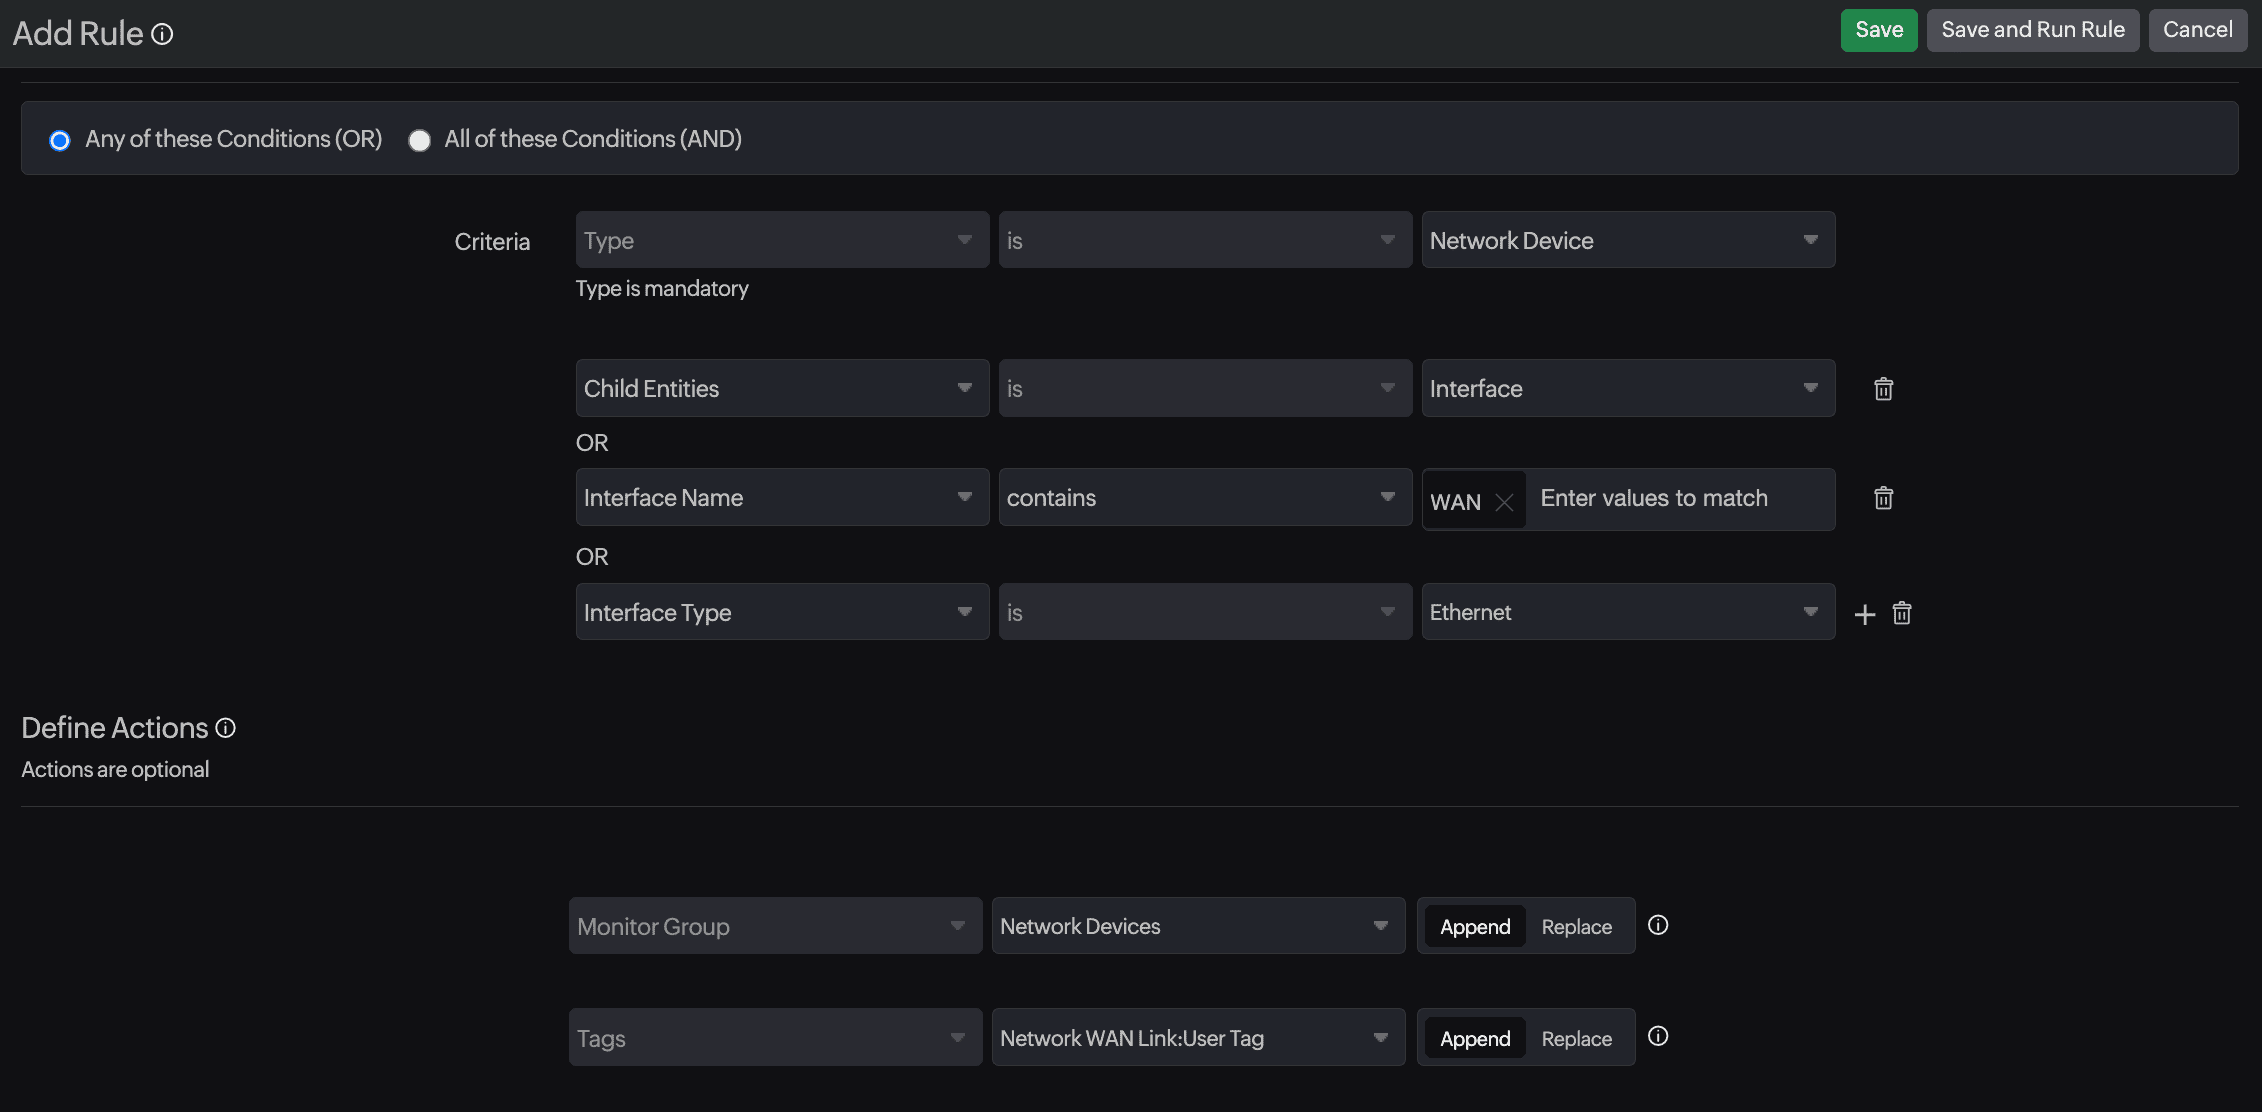
Rule-based interface configuration management
Reinforce interface configuration rules and receive alerts when deviations are detected. This targeted enhancement allows you to add tags to interfaces based on configuration rules, simplifying interface-level organization and management.
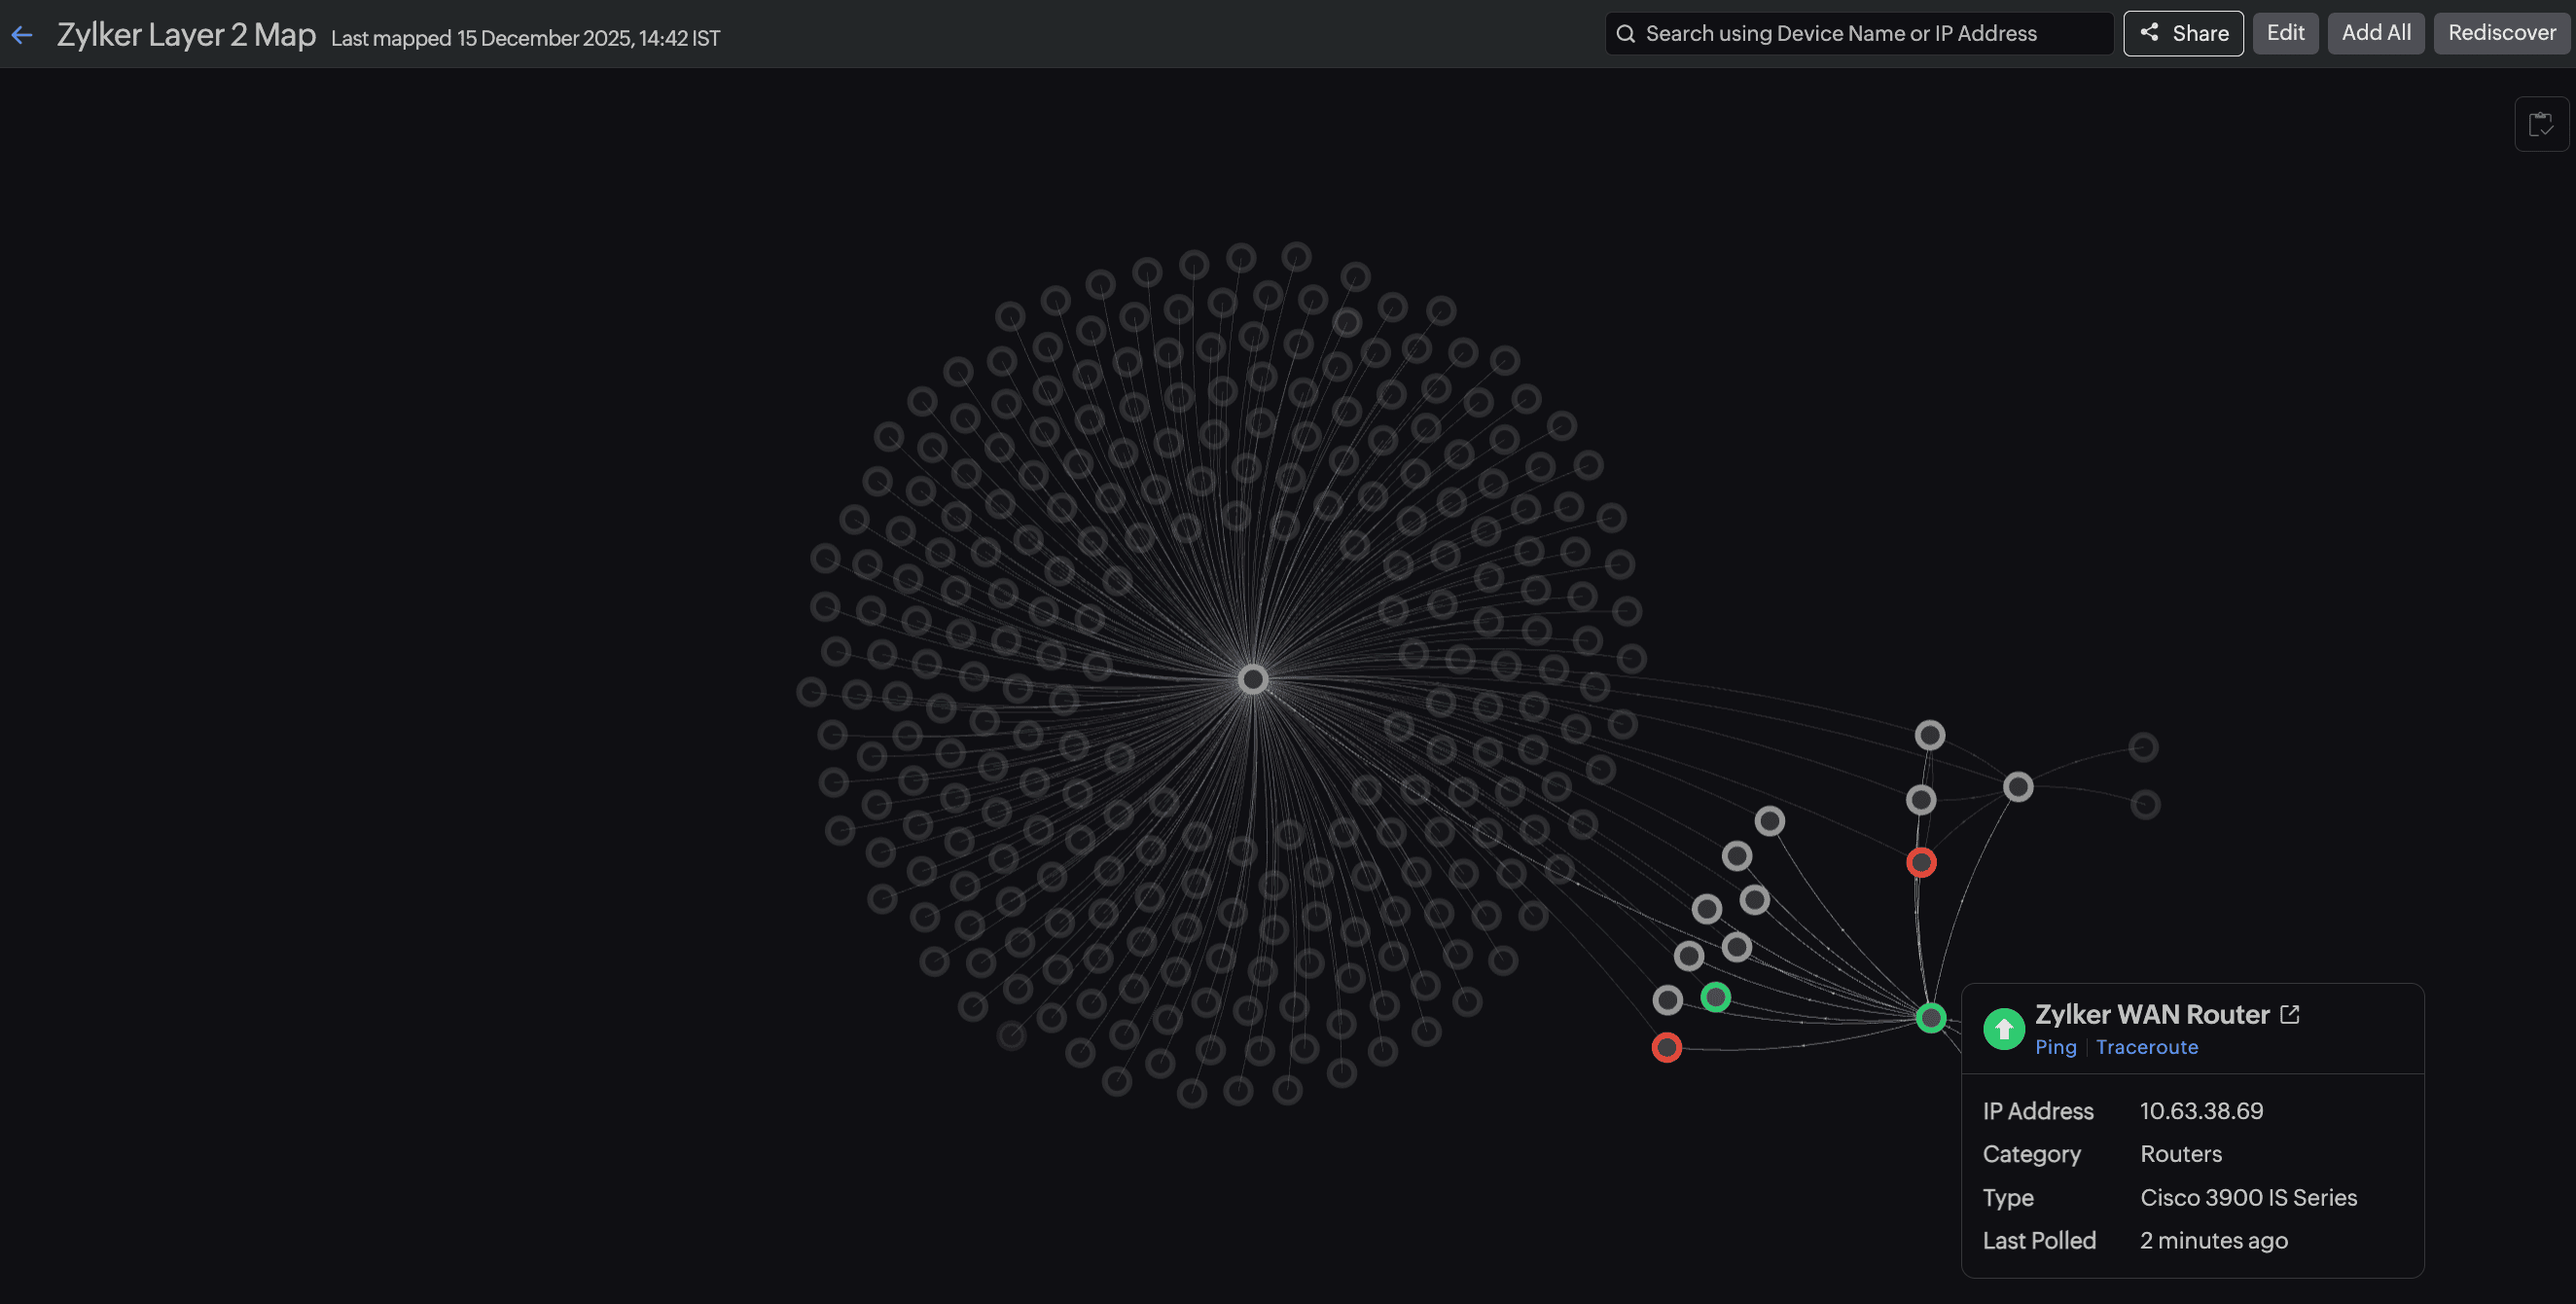
Renewed Layer 2 maps
Reshaping our maps to improve visibility was one of our key objectives, and we’ve made significant progress in this area, reflected in a refreshed interface. You can now add multiple devices directly from your Layer 2 map in just a few clicks, oversee your networks with greater clarity using the map inventory, and share maps securely through controlled access.
Revamped the Unsolicited Traps view
Reducing downtime risks is essential in network monitoring. With this in mind, we upgraded the Unsolicited Traps view to help reduce noise and sharpen alert relevance. When unsolicited traps are received, you can start monitoring them proactively, ensuring critical events are not missed in the future.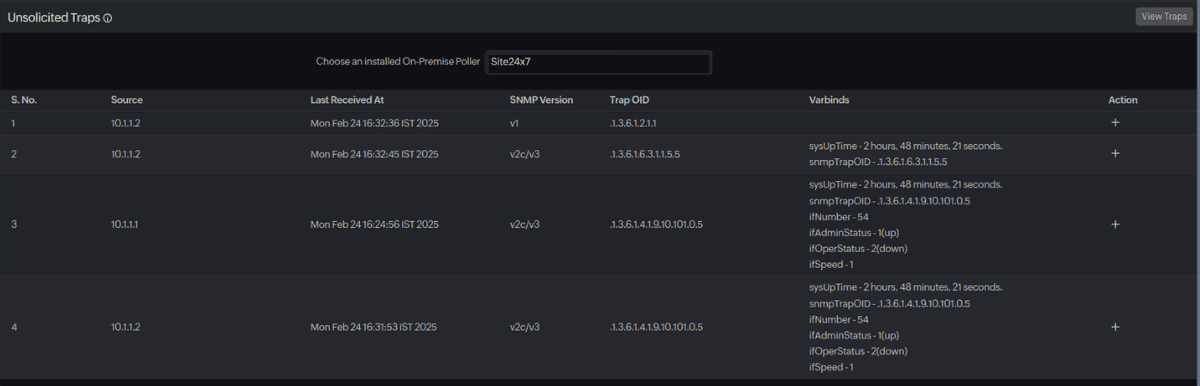
Ramped up NetApp ONTAP cluster performance monitoring
Review how you track disk usage, free space, and storage utilization to mitigate capacity risks and guide growth decisions by monitoring your NetApp ONTAP clusters within Site24x7.
Rolling out support for multiple switch stack device vendors
Ramping up platform coverage has been a consistent goal. In line with this, we extended support for multiple vendors, like Cisco, HP Aruba, Huawei, and Juniper, in switch stack monitoring , delivering broader and more flexible operational coverage.
Reduce downtime risks with expanded WLC support
We expanded support for multiple WLC vendors , including Aruba, Cisco, H3C, Hongxin, Huawei, RUCKUS, and Ruijie. This expansion helps accommodate diverse wireless deployments across enterprise environments.
Refocus your network dashboard to reflect what you need with custom widgets
Respecting the fact that effective network monitoring depends on actionable detail, we refined our widgets into network-focused views that track interfaces, analyze performance, visualize topology, and clearly break down outage impact.
Network traffic monitoring
Resolving gaps in network traffic visibility is essential. To address this, we now discover devices that are sending flow data to the Site24x7 On-Premise Poller but have not yet been added as traffic monitors. This improves depth, clarity, and accuracy in traffic analysis.
Network configuration management
Responding to evolving regulatory requirements and accelerated deployment cycles, we expanded network configuration management (NCM) features to help ensure consistent compliance enforcement and audit readiness.
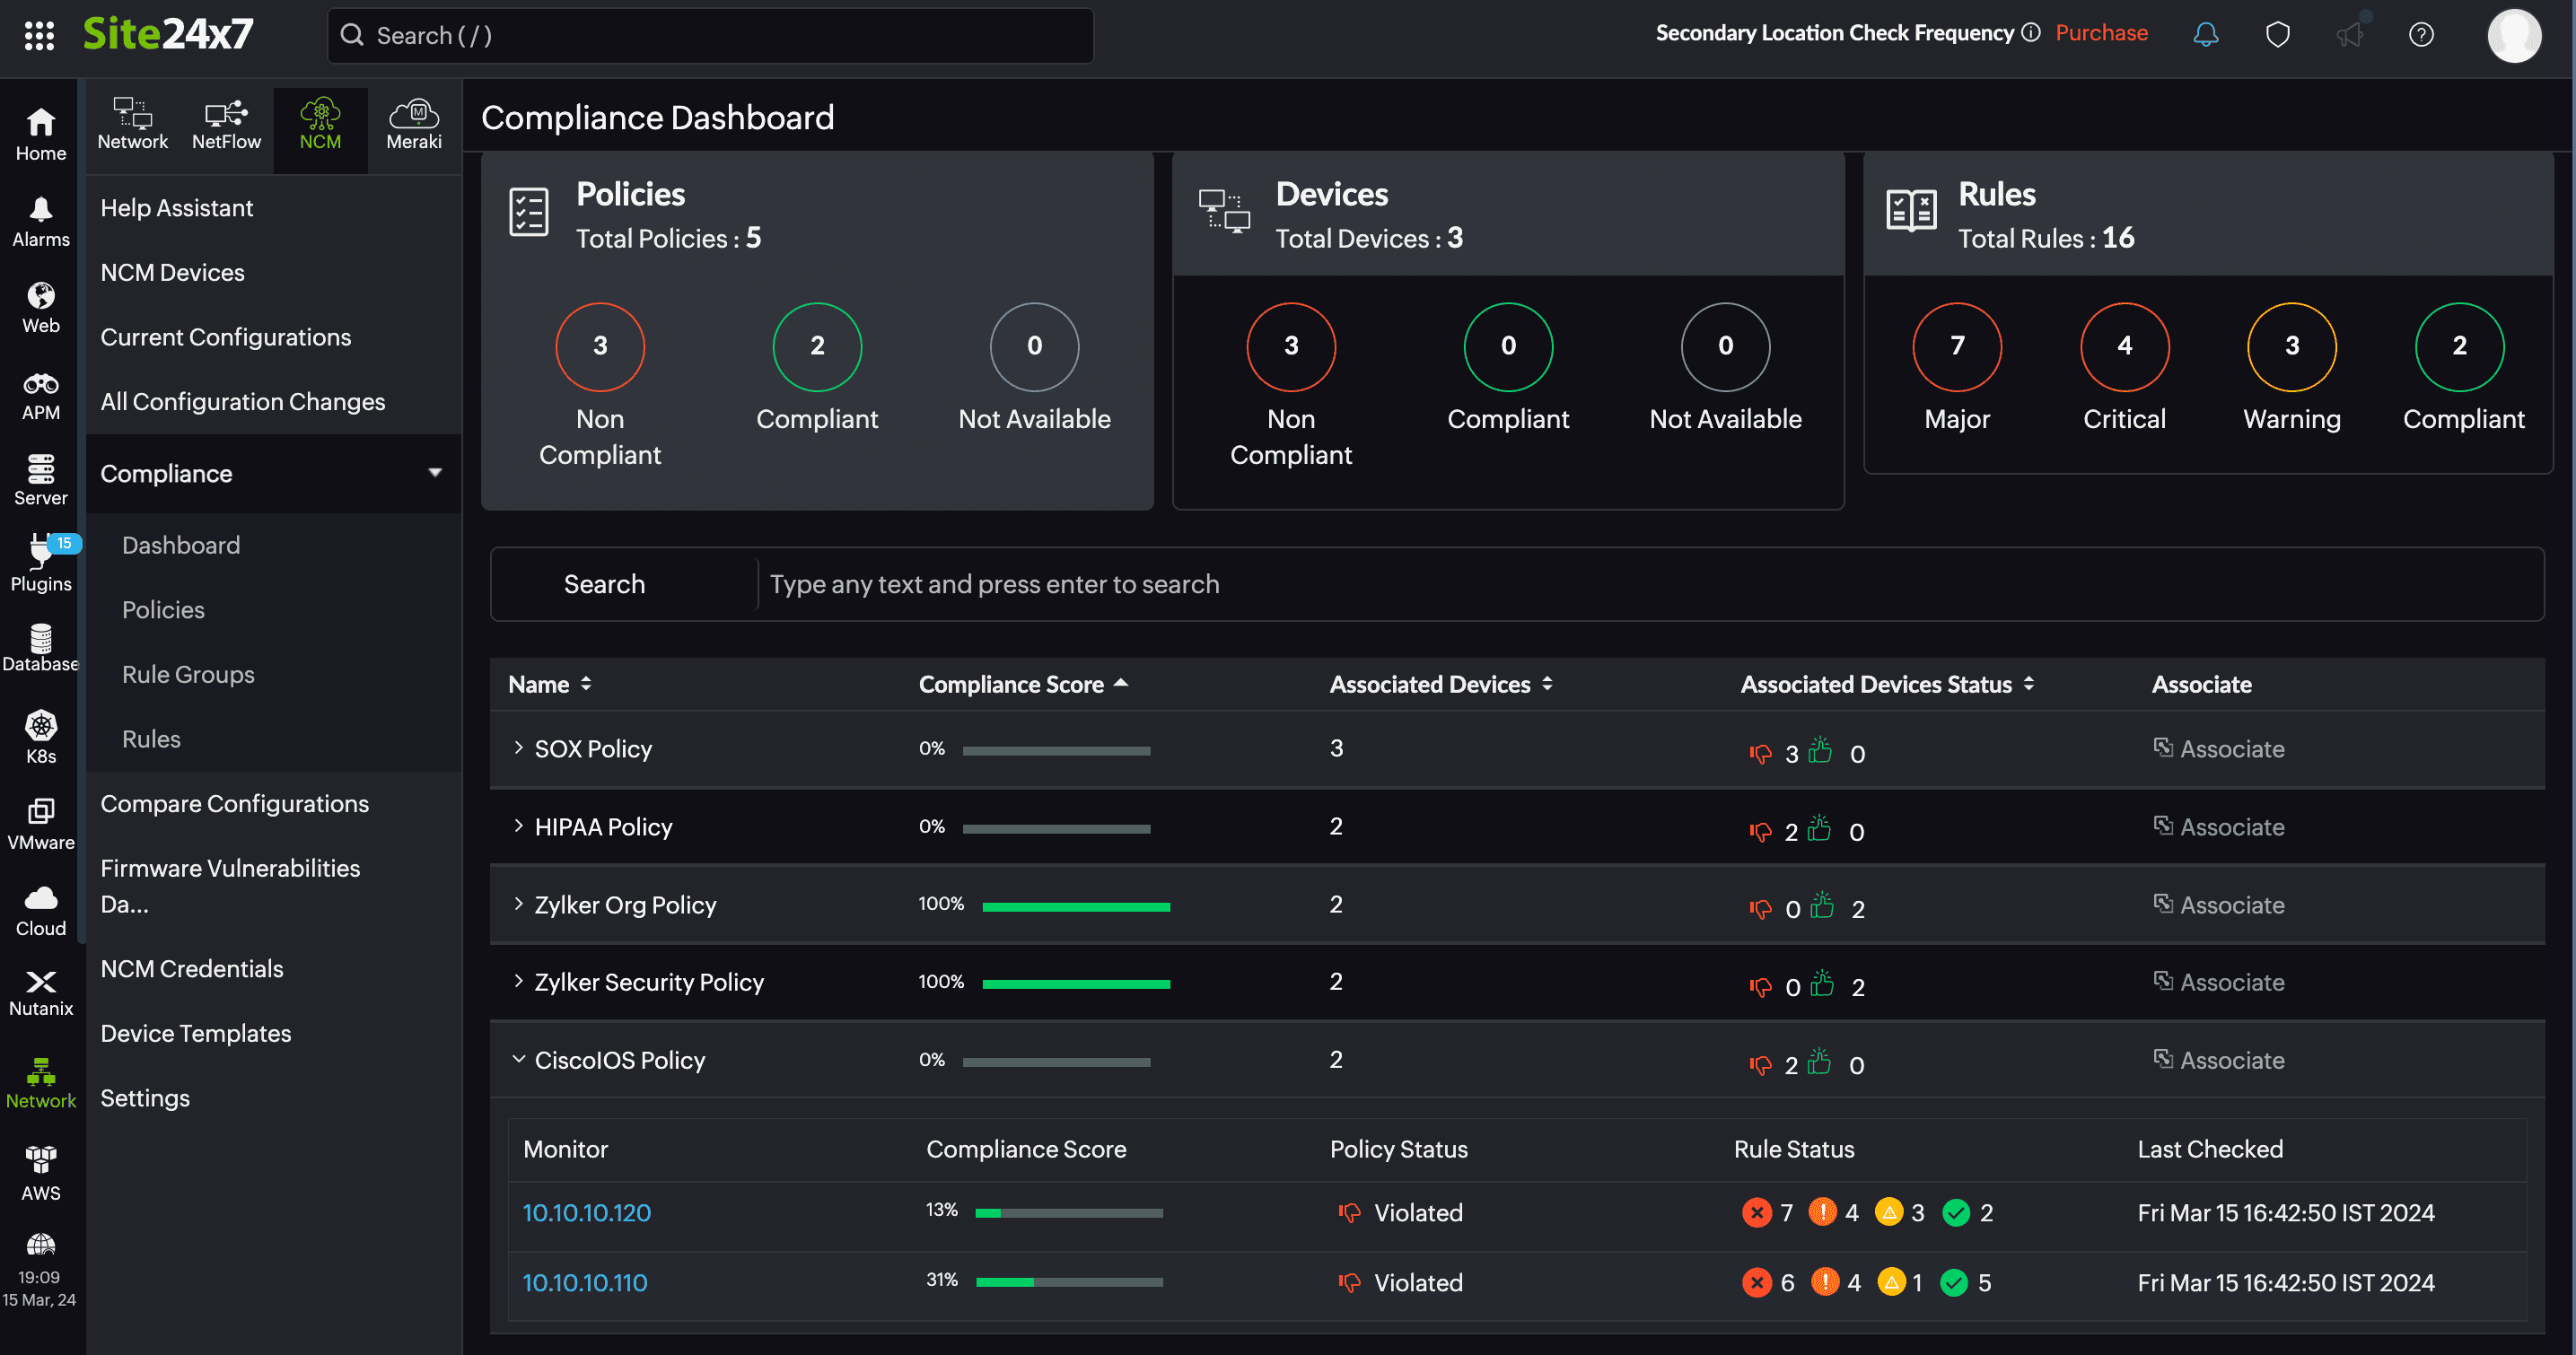
Regularize policy actions for compliance
Retrieve configurations easily
Download device configurations directly from the NCM module to simplify backups and reviews. You can also edit configurations as drafts and upload them with ease.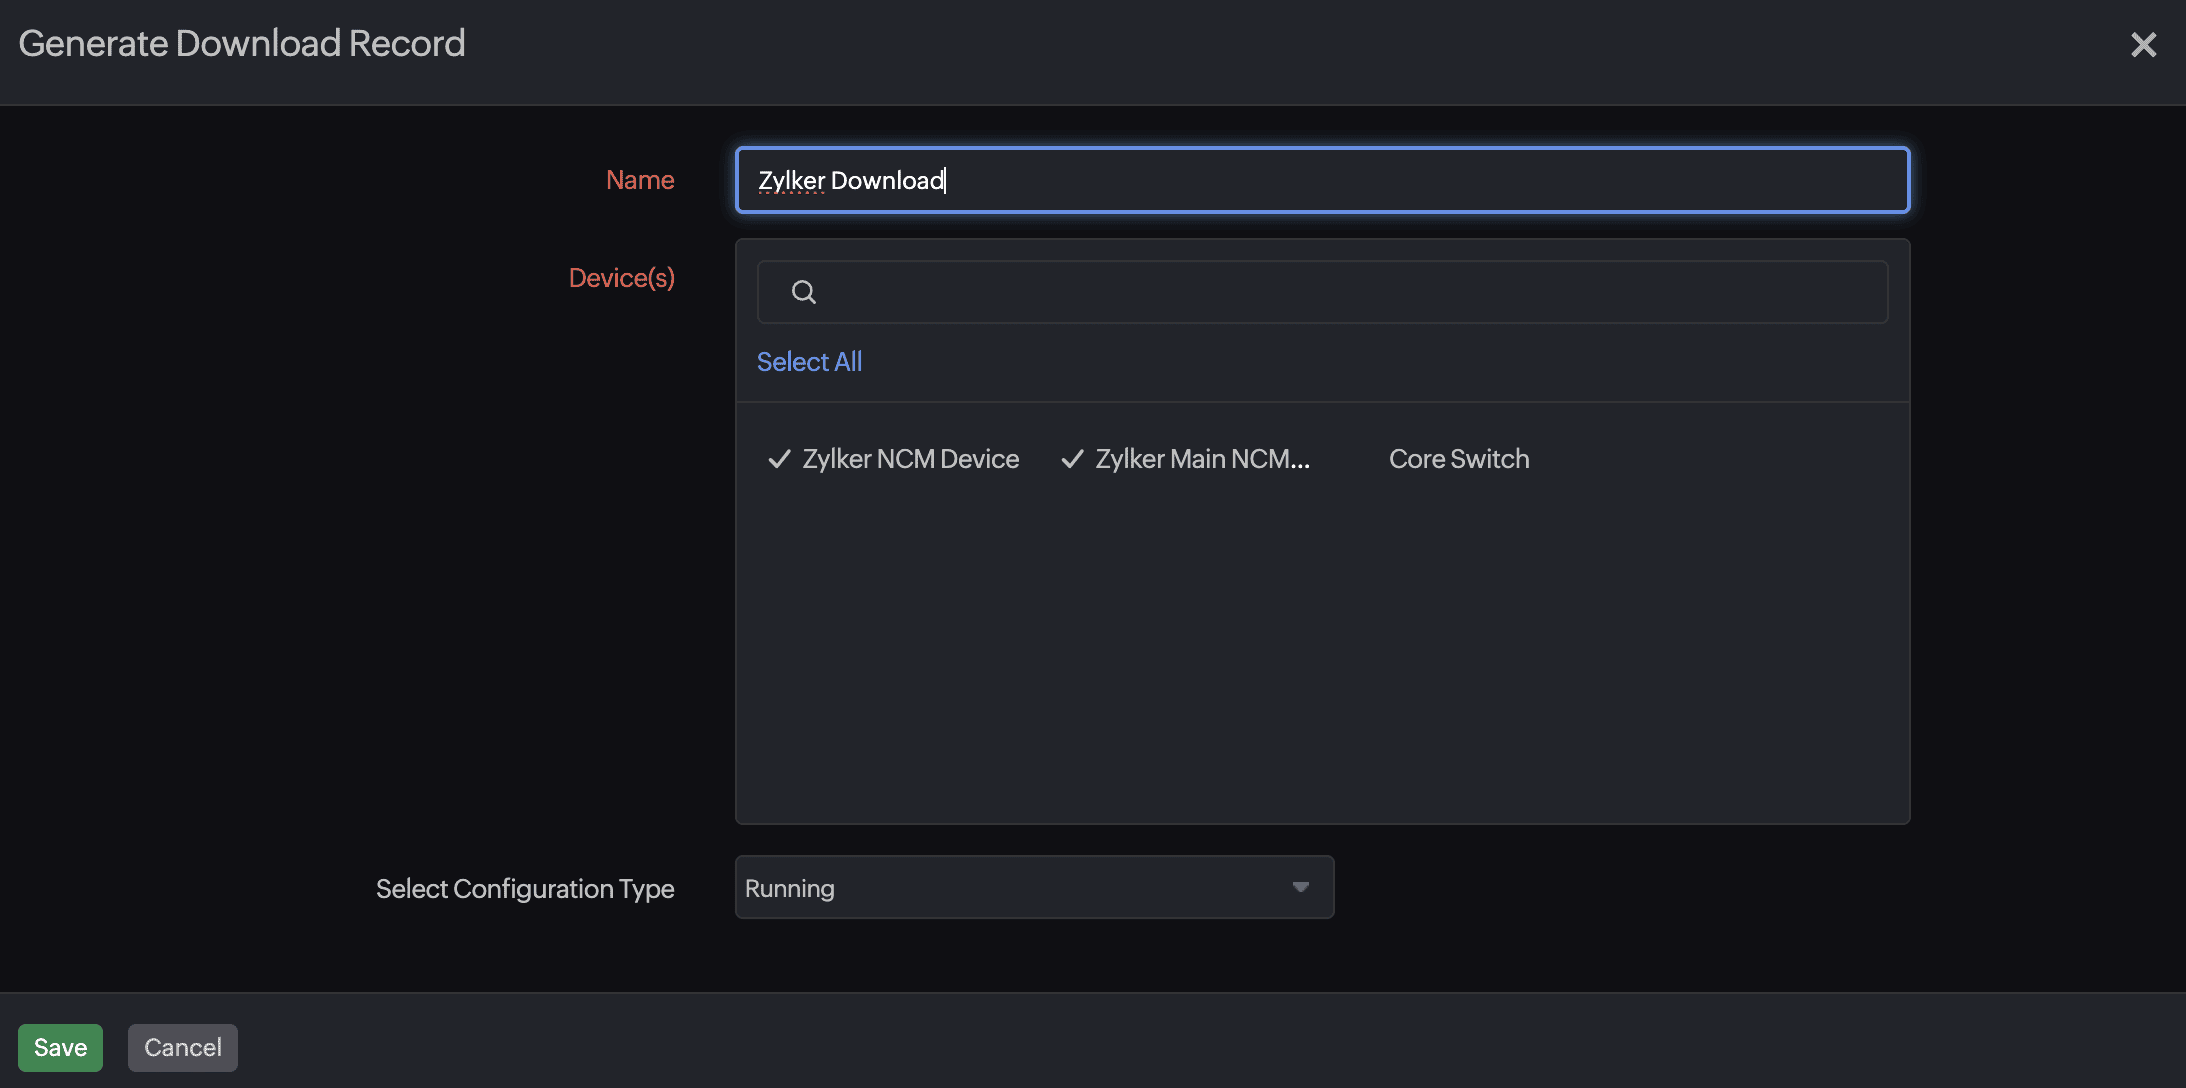
Generate reports on the go
Review and download configurations from your NCM monitors to accelerate backups, audits, and compliance checks. We also introduced multiple reports designed to help you remain audit-ready. As always, we welcome requests that simplify monitoring workflows.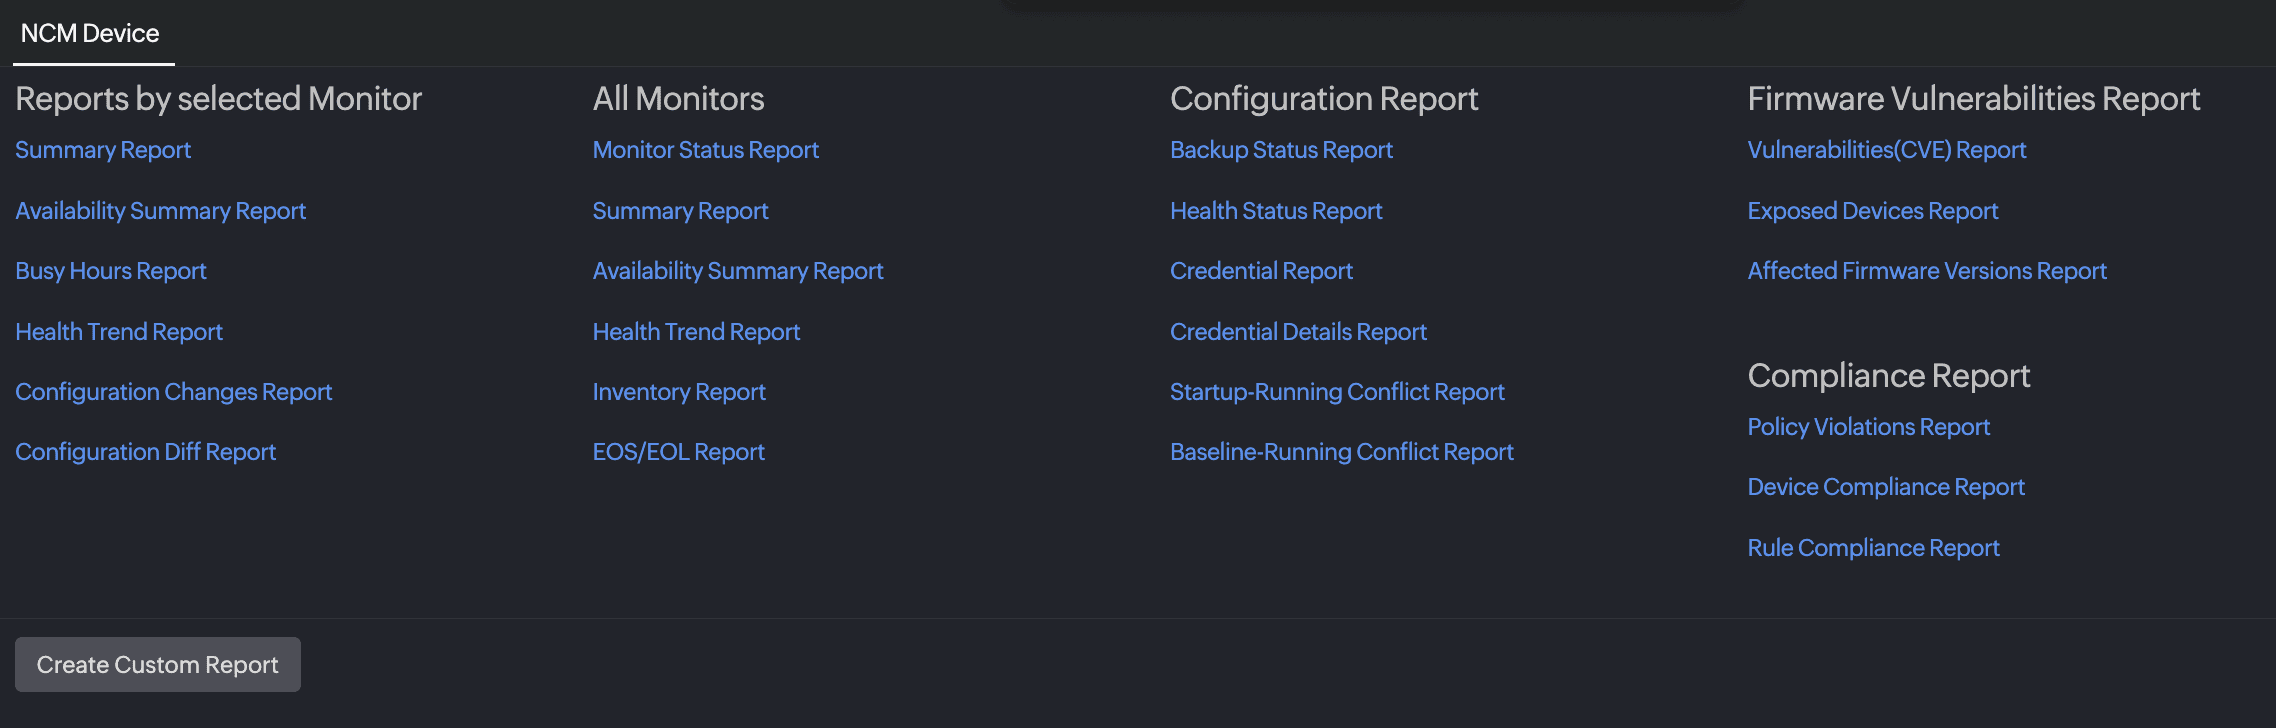
Review unmonitored devices in NCM
Continuing last year’s goal of delivering complete network observability, we now provide a list of devices added as network monitors but not yet configured as NCM monitors . Reviewing this list helps you quickly close configuration visibility gaps.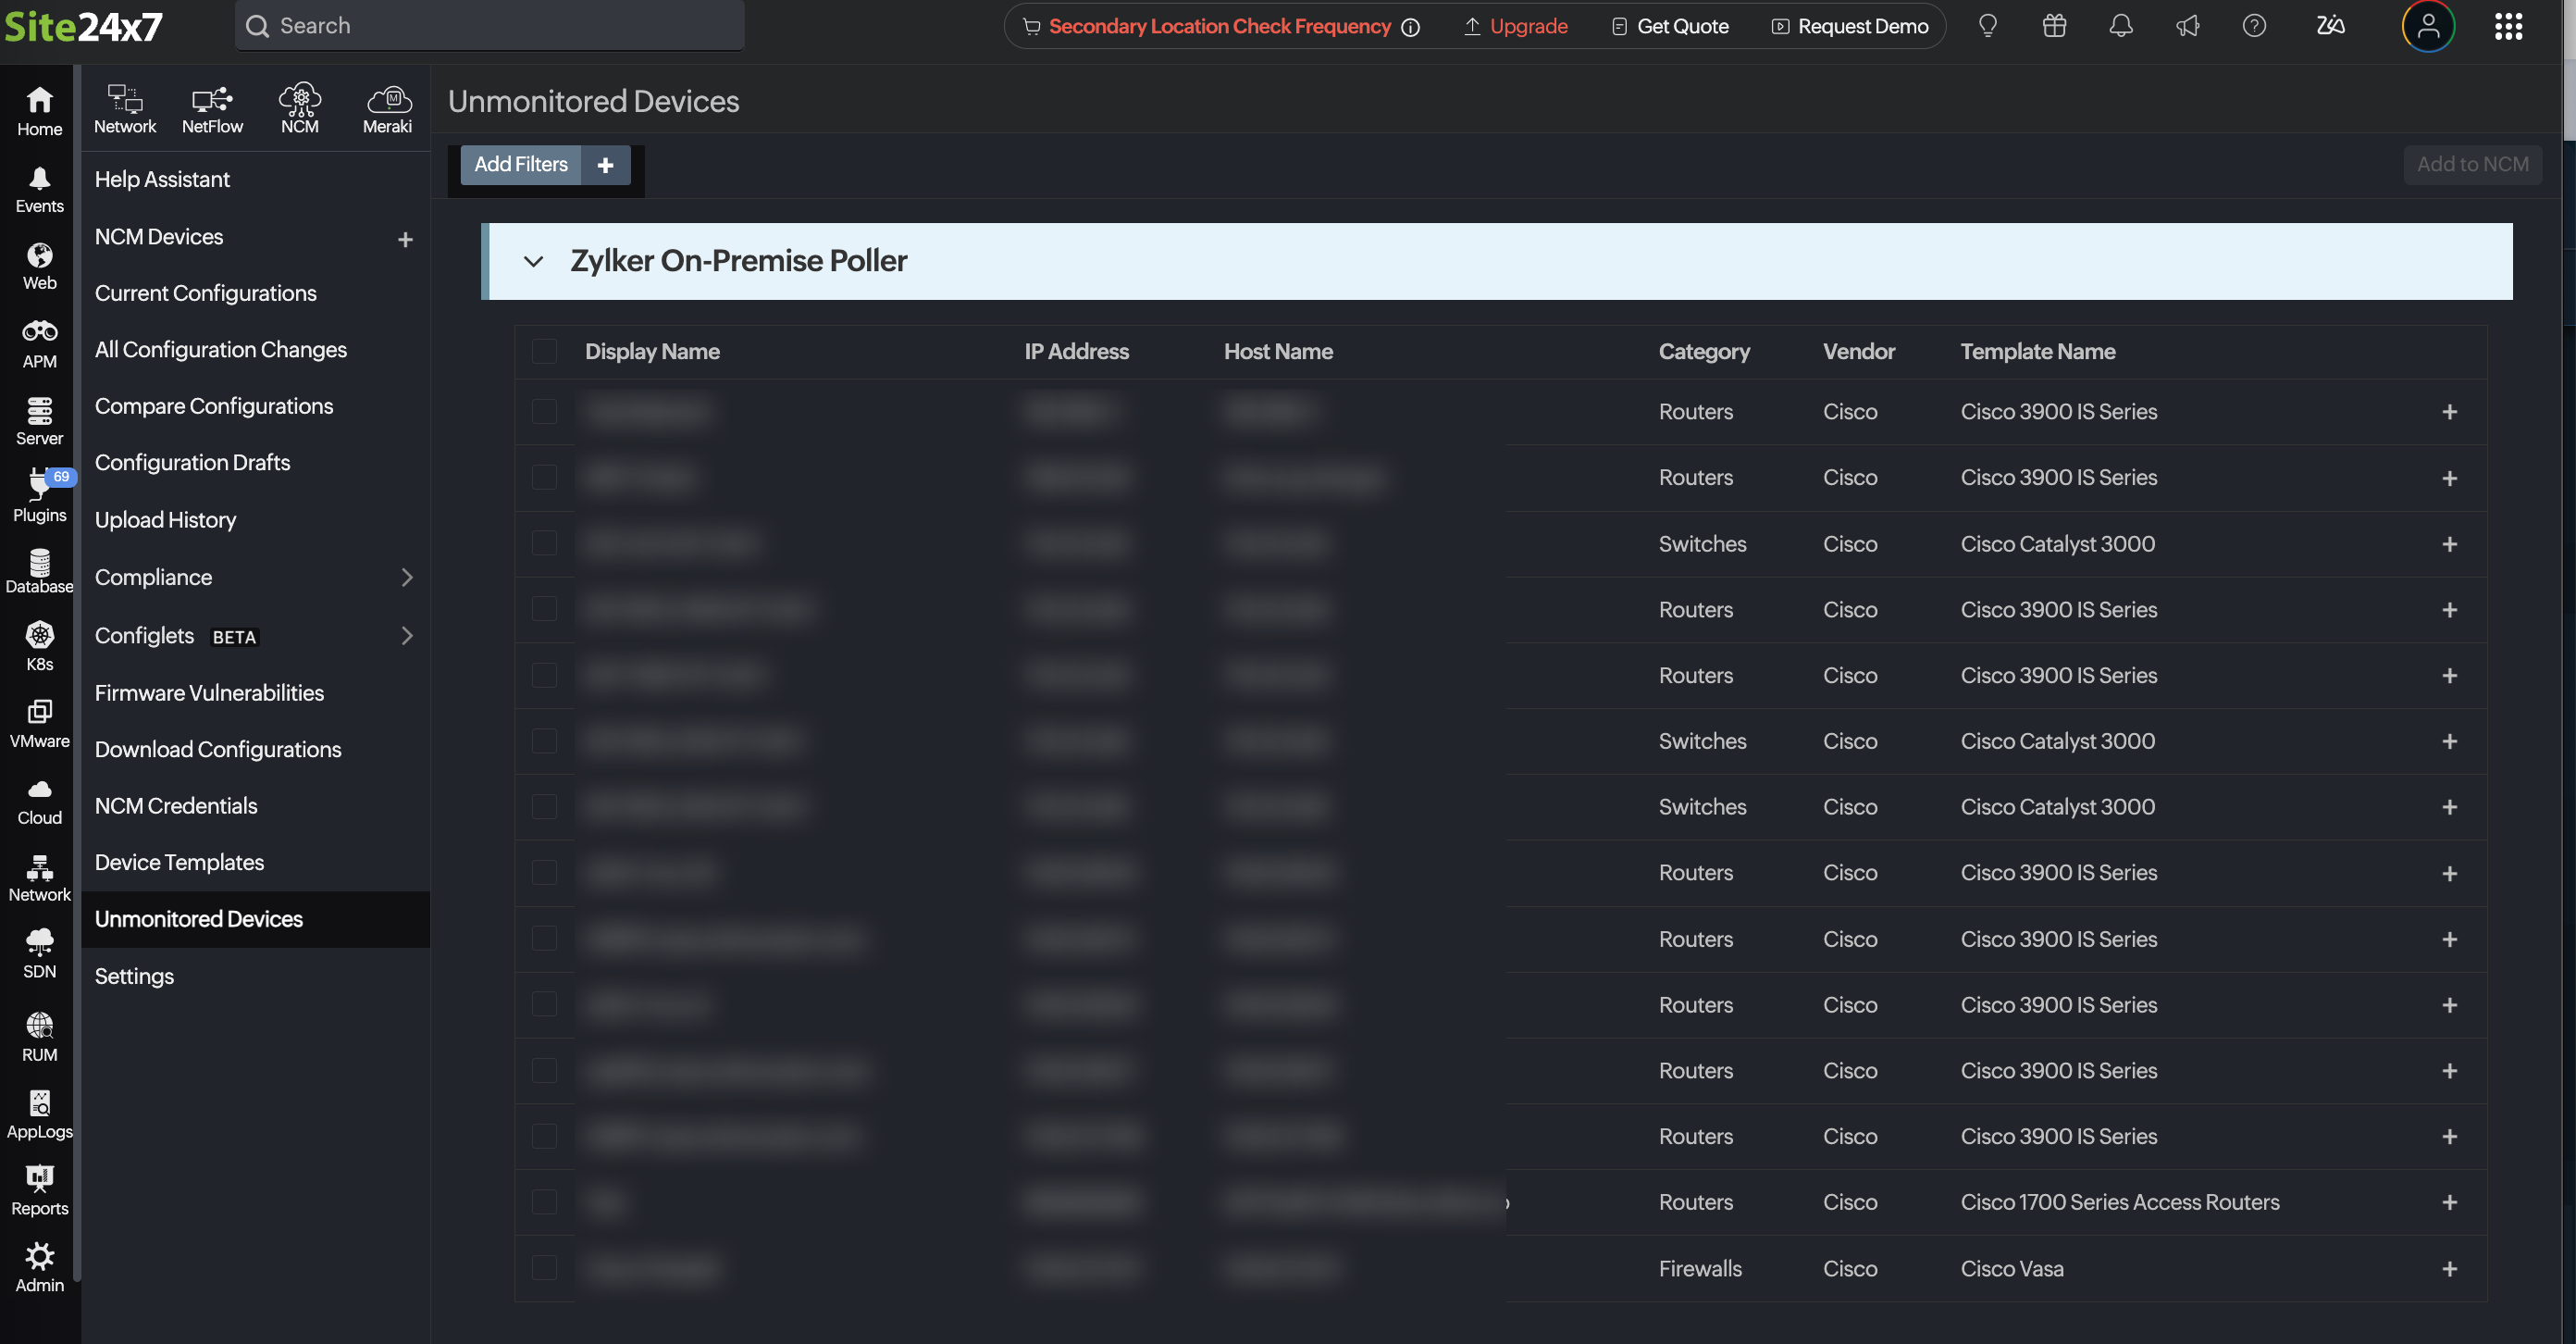
SDNs and SD-WANs
As networks continue shifting toward software-defined architectures, we expanded visibility across SDN and SD-WAN ecosystems, enabling clearer troubleshooting across distributed environments.
Released: VMware SD-WAN monitoring
Rolling out one of our major releases this year, VMware SD-WAN monitoring enables you to review gateway and edge device performance using comprehensive metrics and alerts, visualize topology maps, configure alerts, and apply familiar workflows used across other SD-WAN monitors.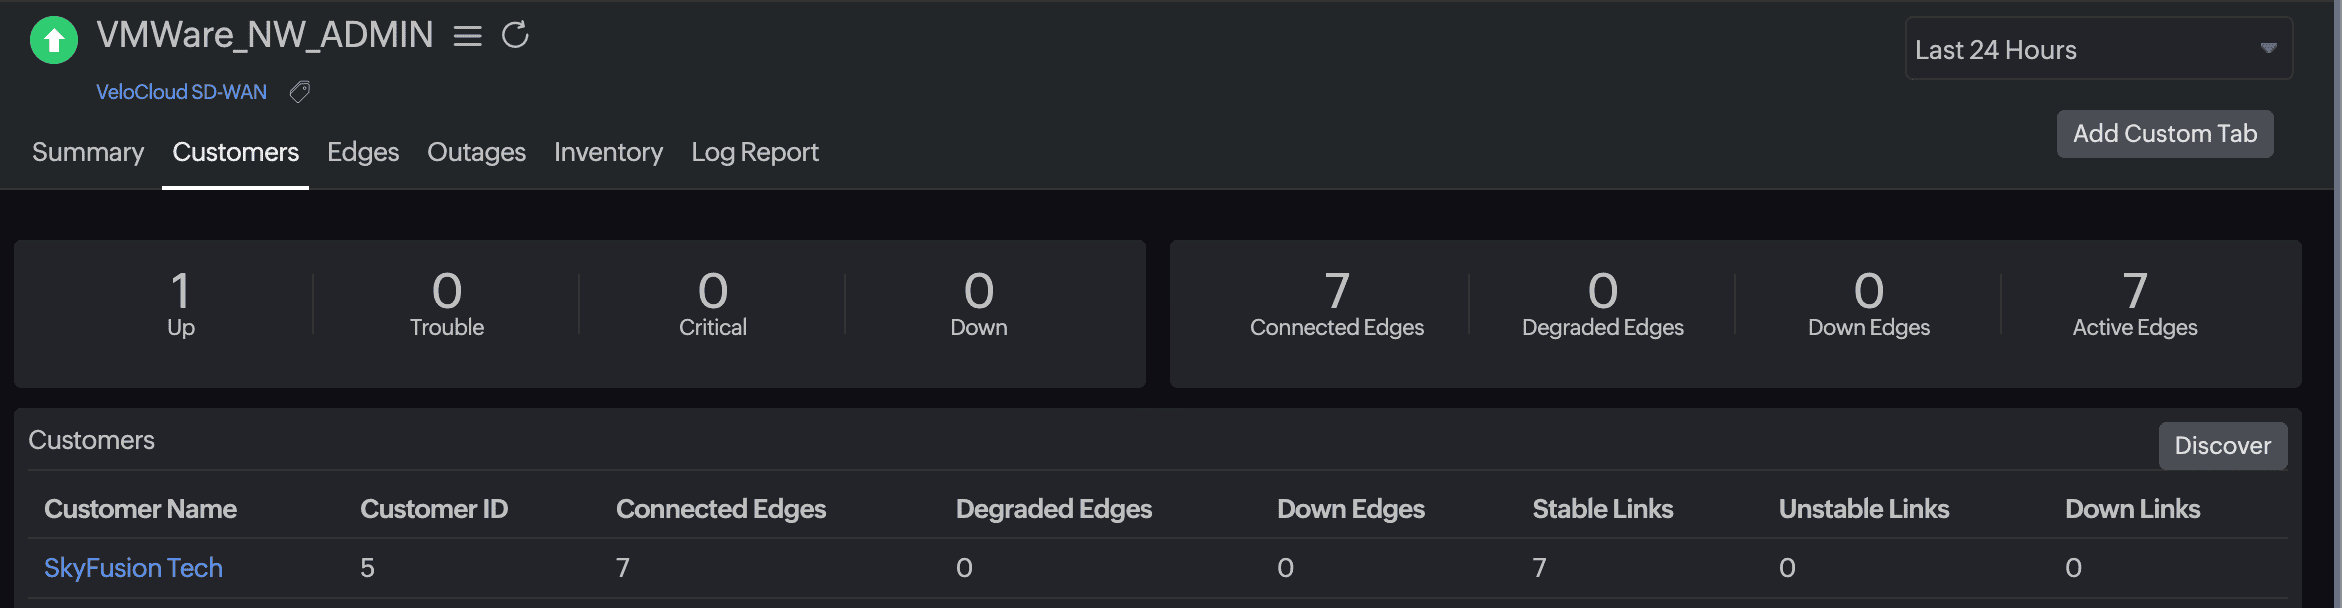
Cisco Catalyst SD-WAN visibility
Try our Cisco SD-WAN monitoring and gain unified insights into Catalyst SD-WAN health and performance. Your feedback will directly shape future enhancements.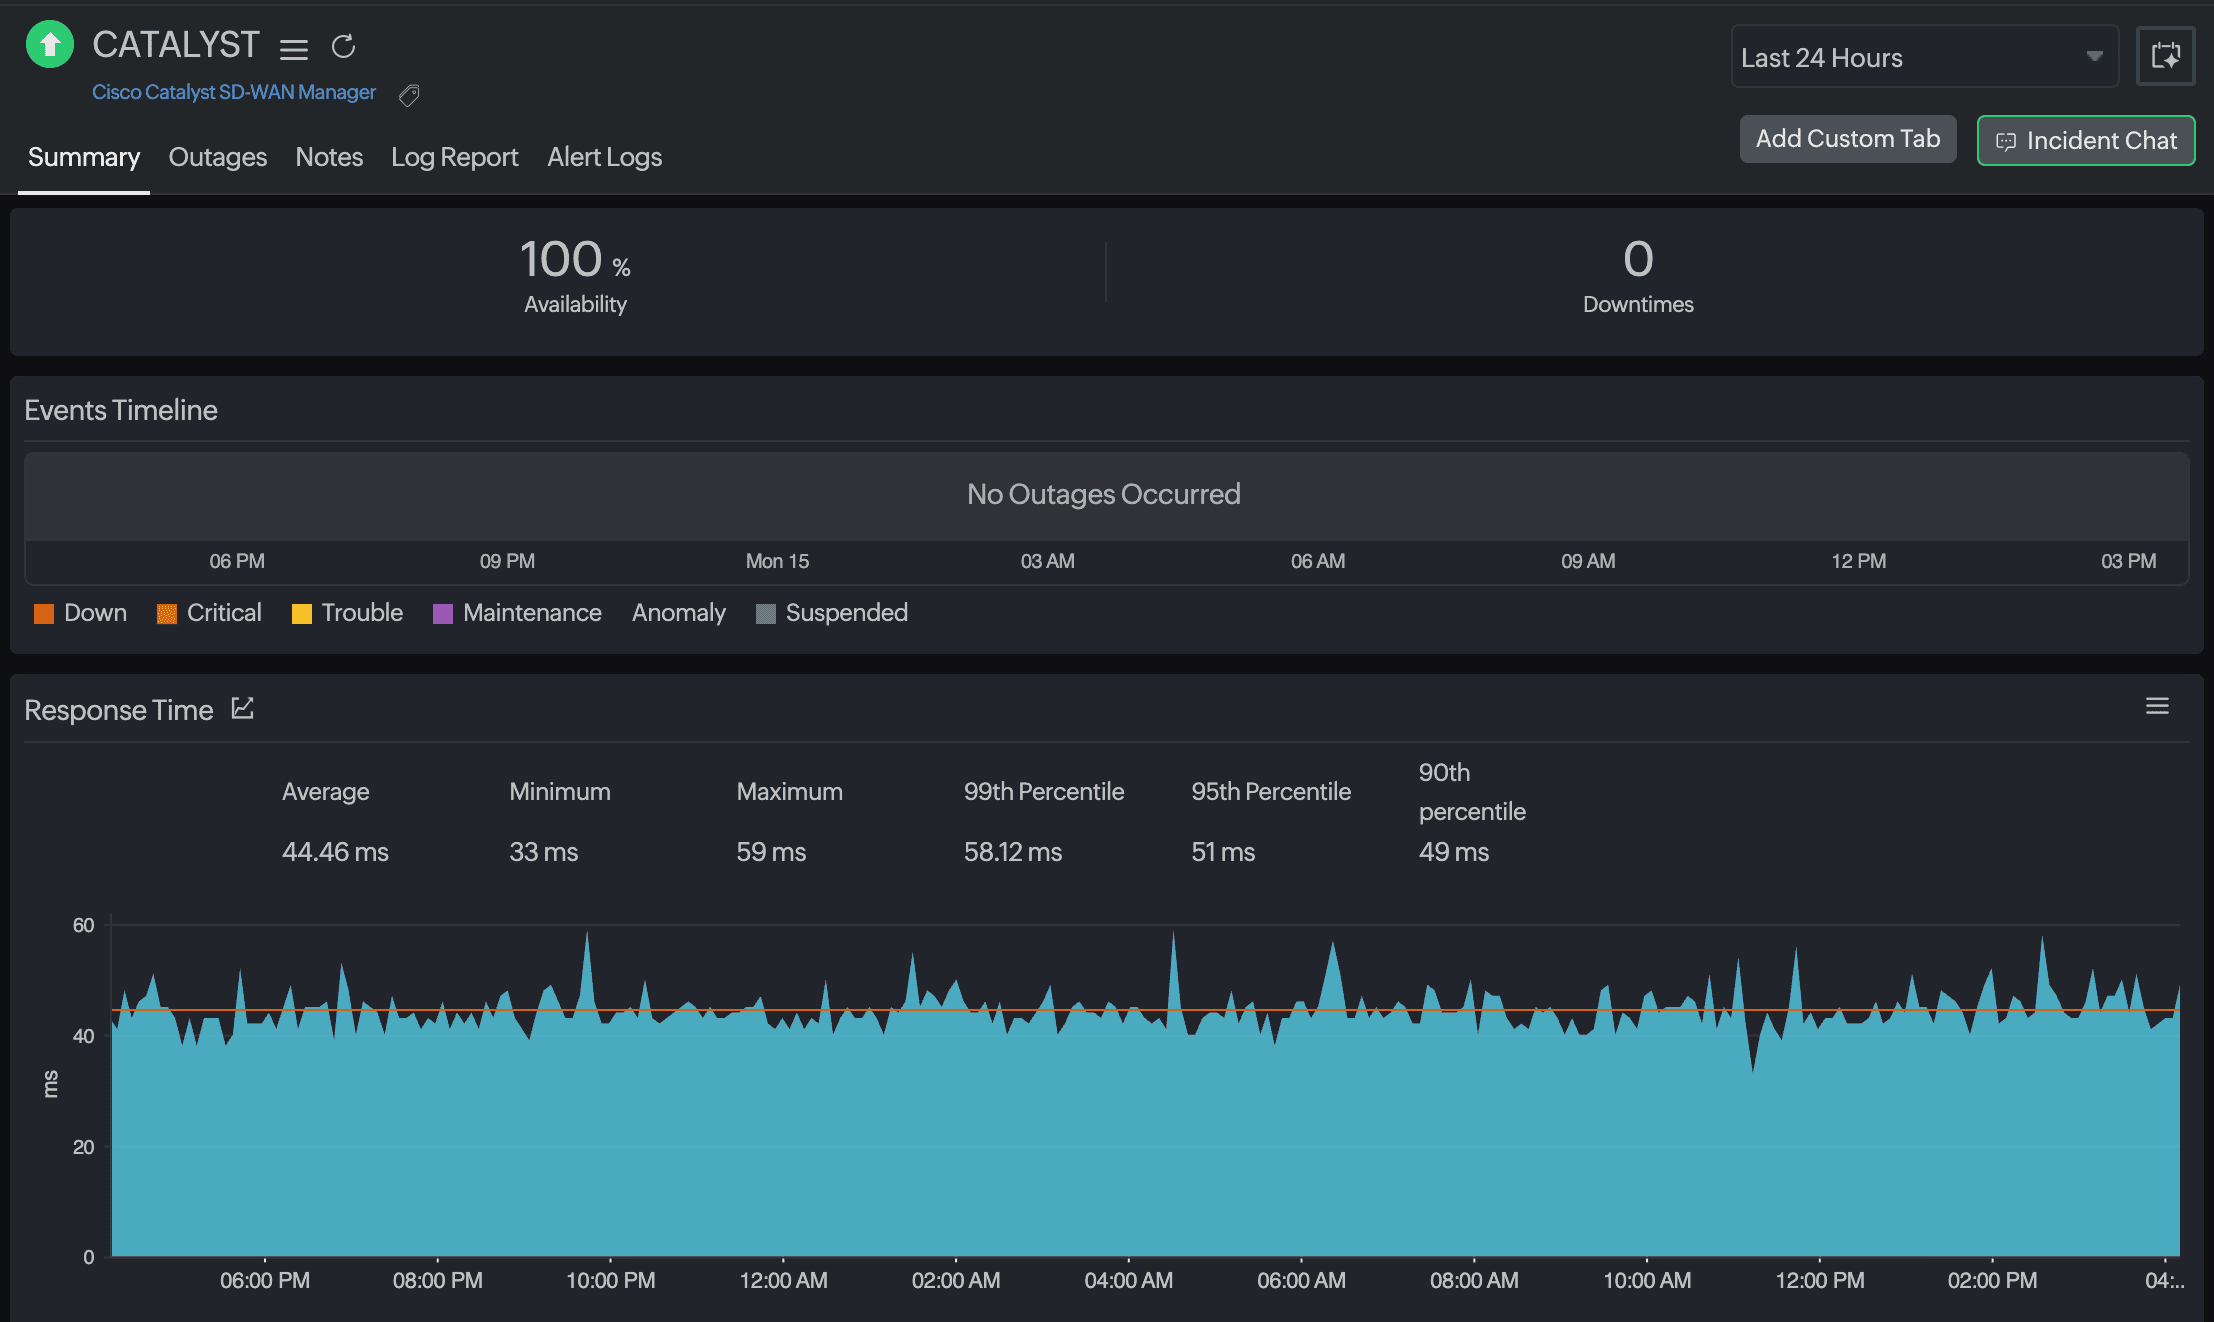
Cisco Meraki enhancements
Expanded support for Sensor and Teleworker device types, along with automatic monitor grouping based on Meraki networks , simplifies large-scale Meraki deployments.
Other enhancements that strengthened the platform
While major features shaped the roadmap, smaller improvements played a key role in improving day-to-day operations:
- Expanded multi-vendor coverage across device types
- Clearer oversight for devices not yet added to network monitoring
- Faster correlation between configuration, traffic, and availability data
Every enhancement was built with the same priority: Give teams the clarity they need to maintain resilient, high-performing networks.
Looking ahead
This year was about refining and reimagining the fundamentals of network monitoring while also steadily marching towards our goal of expanding SDN and SD-WAN monitoring support. Next year, expect deeper analytics, broader SDN and SD-WAN coverage, and continued enhancements across availability, performance, traffic, and configuration management. While we never know what the next year might bring due to rapidly growing AI usage, GPTs, and more, our goal remains unchanged: to help you operate stable, secure, and predictable networks, no matter how quickly your environment evolves. Reliable monitoring and reinforced resilience continue to guide everything we build.

Wishing you a year of stable, resilient networks from the Site24x7 team.